|
|
Updated Chapter
| ||||||||||||||||||||||||||||||||||||||||||||||||||||||||||||||||||||||||||||||
Approach |
Advantages |
Disadvantages |
|---|---|---|
Dedicated Lanes |
|
|
Managing All Lanes |
|
|
Dedicated lane and corridor management strategies can be complementary on a given freeway or region, as exhibited most recently in Minneapolis on I-35W. Specific applications can address mobility from a number of perspectives. Discussions and examples of each of these approaches are provided in the following subsections.
As presented earlier, the primary strategies used to manage demand on dedicated lane facilities generally fall into one of three categories: eligibility, access, and pricing. Each of these strategies and example lane treatments is described below. Definitions are highlighted in Section 8.3.2.1.
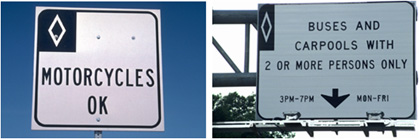
One of the most commonly used lane management tools for the past 40 years is restricting use based on vehicle eligibility. Eligibility can be defined in terms of vehicle type (i.e. buses, trucks, motorcycles, or hybrids) or by the number of occupants in a passenger vehicle, such as two or more (HOV 2+) or three or more (HOV 3+) in a vehicle. The latter definition represents the vast majority of managed lanes found in the US and Canada – high-occupancy vehicle (HOV) lanes. The selection of a lane eligibility policy requires careful analysis to ensure that restricted use will result in sufficient utilization of the managed lane or a benefit for users that justifies the restrictions. One of the goals of vehicle eligibility restrictions is to encourage the use of transit or other high-occupancy modes, or modes that place less of a burden on the transportation system or the environment, such as motorcycles and hybrids. This is accomplished by providing priority treatment for eligible vehicles, particularly during congested peak periods, allowing these vehicles to enjoy travel time savings and more predictable travel times. As such, measures of utilization and of the benefits realized from eligibility restrictions should be expressed in a way to determine whether specific goals of the lane management strategy are being achieved. These measures typically include, but are not limited to:
A further component of eligibility restrictions is whether they are put into effect part-time or full-time. The ability to control restrictions by time-of-day preserves managed lane capacity during peak periods and makes it available to all users during other periods. This added flexibility can help ensure that conditions on the managed lane are maintained according to a specified set of standards when demand is at its highest by allowing eligibility restrictions to go into effect during such periods. Perhaps just as importantly, lifting eligibility restrictions during non-peak periods opens up otherwise unutilized capacity to all traffic and potentially avoids situations where criticism is levied towards a policy that does not make sense in non-congested periods.
The following are examples of managed lane strategies involving eligibility restrictions.
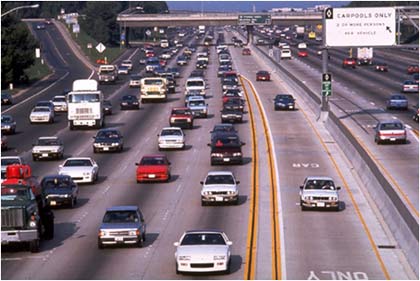
High-occupancy vehicle (HOV) lanes provide preferential treatment for transit, vanpools, carpools, and other designated vehicles by typically dedicating a lane or portion of the roadway for their exclusive use (see Figure 4). The primary goal of HOV lanes is to increase the people moving capacity of a corridor and allow for more efficient use of freeways by increasing the number of occupants per vehicle. This is accomplished by providing travel time savings and reliability for high occupancy modes to incentivize carpooling and the use of transit.
Figure 4: Example of HOV Lanes in Virginia
(courtesy Virginia DOT)
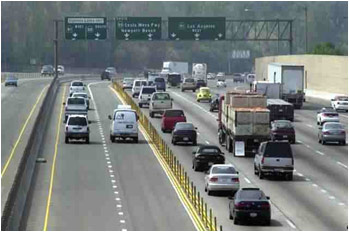
HOV lanes are present on more than 1200 North American freeway route-miles (Figure 5), and are by far the most common form of managed lane. The dedication of lanes for exclusive use by buses, trucks, or other specific vehicle types is less common as these vehicles typically do not constitute a large enough demand or percentage of the traffic stream during significant portions of the day to warrant a dedicated lane. All HOV lanes accommodate buses, and sometimes other vehicles such as motorcycles and hybrids since the combined demand of each of these modes can usually be accommodated by a single lane. The vast majority of HOV lanes are restricted to two or more occupants per vehicle, and this practice has been prevalent for many years (Figure 6).
The majority of HOV facilities exist as single lanes that are concurrent with adjacent general purpose freeway lanes (Figure 4 above). Most commonly, HOV lanes are separated from mixed use lanes by a painted stripe or buffer, although some are separated by a physical barrier, either fixed or moveable. Depending on the design, HOV lanes may have continuous access to concurrent flow lanes (previous Figure 4) or traffic may only be able to enter and exit at designated access locations (Figure 7). Some HOV lanes are reversible to serve directional demands at different times of the day; these facilities are separated by a permanent barrier and are accessed via exclusive ramps (Figure 8). Contraflow HOV lanes borrow an off-peak direction lane for peak commute purposes, and they use placement of pylons or moveable barriers to safely segregate oncoming traffic flow (Figure 8). (Design treatments used for HOV and other managed lanes are covered later in Section 8.5)
Figure 5: Growth in HOV Lanes, 1969-2000 (Fuhs, Charles and Jon Obenberger, "HOV Facility Development: A Review of National Trends," published in "HOV and Demand Management 2002," Transportation Research Record No. 1781, Transportation Research Board, Washington, DC, 2002.)
Figure 6: Occupancy Restrictions Common on HOV Lanes (Fuhs, Charles and Jon Obenberger, "HOV Facility Development: A Review of National Trends," published in "HOV and Demand Management 2002," Transportation Research Record No. 1781, Transportation Research Board, Washington, DC, 2002.)
Figure 7: Access Restricted HOV Lanes
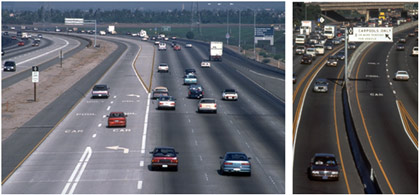
Figure 8: Examples of Reversible (left) and Contraflow HOV Lanes (right)
Eligibility restrictions serve as the primary means to manage lane HOV lane performance. The policies that guide these restrictions can be modified in several ways to make the HOV lane operate more efficiently. Eligibility can be varied by time of day and within the peak period. For example, I-10 in Los Angeles, once operational, will restrict use to HOV 3+ and priced vehicles in the peak hours and HOV 2+ and priced users in the off-peak periods. Some lanes are restricted to exclusive use by buses (see next section on busways). However, many HOV lanes allow other eligible vehicles including motorcycles, certified hybrid or alternative fuel vehicles.
The performance of an HOV lane is governed by many factors. These include:
Experience with HOV lanes around the country has generally shown them to be an effective strategy to provide traffic congestion relief when other options are not feasible or have already been implemented. Effective HOV lane operations provide greater person throughput volumes than adjacent general purpose lanes. However, since these lanes are managed to have less actual vehicle volume than other lanes at capacity, they are often perceived as being underutilitized by the public. The term "empty lane syndrome" refers to situations where underutilization of HOV lanes on heavily congested corridors leads to public criticism. In 1998 a 20-mile segment of HOV lanes opened on I-287 in New Jersey. Underutilization of the lanes during peak periods caused such a negative drop in public opinion that the governor announced the elimination of the HOV lanes on this and a nearby successful corridor. A survey of HOV operators revealed that underutilization is a common issue that has resulted in policy changes across the country (Chang, M., J. Wiegmann, A. Smith, and C. Bilotto. A Review of HOV Lane Performance and Policy Options in the United States. Publication FHWA-HOP-09-029. FHWA, U.S. Department of Transportation, 2008).
Fixed eligibility restrictions do not always work well in dynamic settings where lane utilization cannot be fully managed in real time. For this reason other tools are increasingly being applied in conjunction with eligibility to gain improved effectiveness in lane performance. HOV performance issues such as underutilization have traditionally been addressed by changes in occupancy requirements and hours of operation. However, changes in occupancy requirements can result in dramatic outcomes for performance. These changes often do not allow for the optimal redistribution of road capacity and can cause HOV facilities to operate at conditions that are less than ideal, even if they are meeting or exceeding person movement goals. As an example, the reversible HOV lane on the I-10 (Katy Freeway) in Houston was originally restricted to buses and vanpools when it opened in 1984. In response to the appearance of underutilization, registered carpools carrying a decal were also permitted to use the facility. The occupancy requirements for carpools started at HOV 4+ in 1985, but were soon dropped to HOV 2+ in 1986 without the registration process. By 1998 high traffic volumes during the morning peak periods were causing conditions on the HOV lane to deteriorate, so minimum occupancy requirements were raised to HOV 3+ during the peak hours. Immediately after the conversion to HOV 3+, the total morning peak volumes on the lane dropped 62 percent, leaving the lanes once again underutilized (Turnbull, K.F. Houston Managed Lanes Case Study: The Evolution of the Houston HOV System. Publication FHWA-OP-04-002. FHWA, U.S. Department of Transportation, 2003).
The breadth of the HOV topic is far too great to be covered in detail in this Handbook, so the following guidance references are provided for additional information:
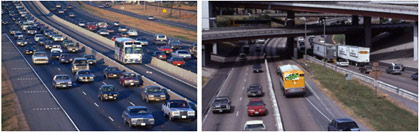
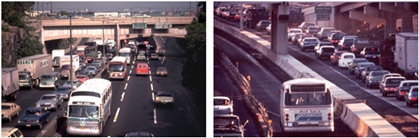
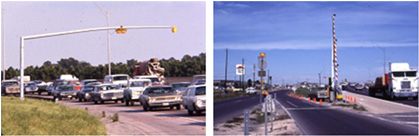
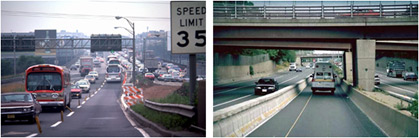
The HOV concept first manifested itself in the form of a bus-only freeway lane. The first HOV lane implemented in the United States was the I-495 Express Bus Lane (XBL) approaching the Lincoln Tunnel in northern New Jersey in 1969 (Figure 9). This lane borrowed an off-peak direction lane for bus-only use, and today still moves more passengers per hour than any other bus corridor in the nation. (See case study at the end of this chapter for more information). Also in 1969 an interim bus-only lane was opened through a construction work zone on the Shirley Highway (I-395) in northern Virginia near Washington D.C. (Figure 9). This project served such a high volume of buses that, when the corridor reconstruction was completed, dual express lanes were opened and restricted to buses. The term busway is commonly used to refer to facilities that are reserved for exclusive use by buses. A bus-lane, more commonly located on a major arterial or roadway on separate right-of-way, is usually a component of a Bus Rapid Transit (BRT) system and as a result the terms bus-lane, busway, and BRT are sometimes used synonymously. However, there is a distinction between a lane dedicated to exclusive use by buses and BRT, which may include various operational improvements and station design features to provide high quality service for express bus trips. The type of service may also be substantially different, focused on limited express stops enroute or point-to-point nonstop service.
Figure 9: Early Bus-Only Lanes on Freeways in the US
Route 495 XBL (left) and I-395 Shirley Highway Interim Bus Lane During Construction (right)
(right photo courtesy of Northern Virginia Transportation Commission)
Bus operation needs today are normally addressed and integrated into HOV lanes on freeway corridors that experience high levels of congestion and have high use or potential for bus transit services. The purpose of bus lanes and supporting facilities (e.g., transit stations, park-and-ride lots and direct access treatments) is to provide more reliable bus service by cutting down the delay that buses would have to otherwise incur in congested traffic, thereby increasing service efficiency by allowing more peak trips by the same bus and providing patrons a faster trip. Bus-lanes on freeway corridors are usually shared with HOVs and other designated vehicles since buses generally use little capacity. An example is the I-110 Harbor Transitway that carries buses and HOV-2+ vehicles in the median of the freeway. There are six bus stations along the Transitway that serve many bus routes including a BRT route. Although the Transitway serves all types of HOVs and will soon incorporate solo vehicle pricing, it includes several sections where bus-only lanes and separate roadways into stations for buses exist. Houston has a similar approach to serving express bus transit on reversible HOV lanes and express toll lanes with direct access ramps connecting stations and park-and-ride lots.
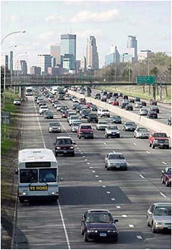
The use of freeway right side breakdown shoulders by buses is permitted in several states. The Minneapolis/St. Paul metropolitan area has the most bus-only shoulders in the country (Figure 10). Early implementations of bus-only use of shoulders in the region were limited to arterial roads, but the concept was soon expanded to freeways after they were shown to be safe and hugely successful. As of 2006, there were 271 bus-only shoulder miles on freeways in the Minneapolis/St. Paul metropolitan area (Federal Transit Administration, Bus-Only Shoulders in the Twin Cities. FTA-MN-26-7004, June 2007). The Minnesota DOT has instituted a series of guidelines that govern the use of freeway shoulders by buses. These guidelines allow buses to use the shoulder only when mainline speeds are less than 35 mph and prohibit buses from exceeding the speed of adjacent traffic by more than 15 mph, up to a maximum speed of 35 mph.
Figure 10: Bus on Shoulder Lane, Minneapolis, Minnesota (courtesy Minnesota DOT)
The goals of various forms of truck lanes are to improve traffic operations and safety, and facilitate the flow of goods (7). Truck lanes fall into the following categories:
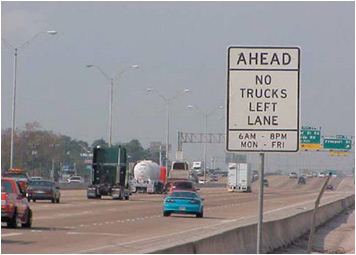
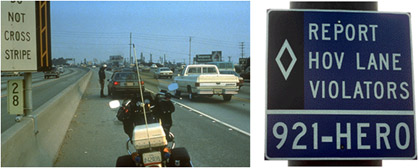
Lane restrictions typically prohibit trucks from using the far left lane of a freeway. At least three travel lanes are normally needed to implement lane restrictions. Many states have adopted this type of lane restriction because it promotes a more orderly mix of traffic and thereby improves throughput, increases sight distance in leftmost lanes, generally improves safety, and still permits the orderly movement of trucks. Lane restrictions through construction zones are used to move the trucks away from workers and from leftmost lanes that may be narrower than outside lanes. Sometimes truck restrictions are implemented on entire corridors to limit trucks by weight, number of axles, or to completely prohibit them from using a corridor. Example signing is shown in Figure 11.
Figure 11: Example Signing for Truck Restrictions
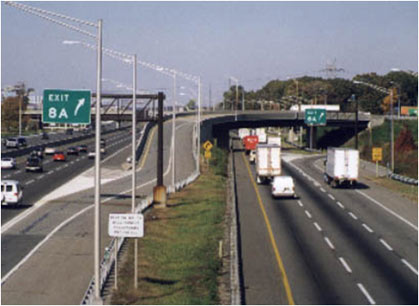
Separated roadways for trucks are less common. One example is the New Jersey Turnpike, the northern portion of which features completely separated dual roadways, one reserved for passenger cars only, and the other open to both commercial and non-commercial traffic. Access ramps are provided to both roadways at major interchanges (Figure 12). Light trucks are considered as eligible vehicles on some HOV lanes if they carry the requisite persons. Restricted geometrics on many existing concurrent leftmost median lanes limit opportunities to serve large commercial trucks, and sight distance and other freeway lane prohibitions typically mean these vehicles cannot use leftmost lane treatments unless a separate roadway is provided with a minimum of two travel lanes.
Dedicated roadways for trucks are being studied and in at least several cases proposed, but no freeway examples currently exist in the US. There are truck lanes on European motorways leading in and out of the ports in Rotterdam in the Netherlands. Missouri is currently considering using dedicated roadways for trucks on I-70 across the state, and several U.S. port cities are examining truck lanes and roadways.
Figure 12: New Jersey Turnpike Dual Roadways Segregating Truck Movements (courtesy New Jersey Turnpike Authority)
Climbing lanes for trucks typically are built to improve safe operations on grades by separating slow moving heavy vehicles from the rest of traffic. These lanes have become a common practice and AASHTO (8) provides established criteria.
Interchange bypass lanes for trucks have been implemented in Southern California and Portland, Oregon, to improve safety by routing trucks around a major interchange typically containing left hand ramps. This design approach improves the merge condition affecting traffic operations at the interchange. Similar ramp options are provided for trucks on this separate roadway system as are provided for the mainlanes.
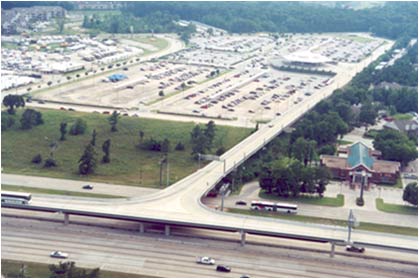
Regulating access is another tool to manage the flow of traffic on a managed lane facility. Limiting access allows traffic to move with minimal disruptive impacts caused by vehicles frequently entering and exiting. Access to a facility can be limited using direct access ramps, physical separation or lane markings with appropriate signage. Limiting access is often one component of a broader set of lane management strategies. For example, HOV lanes may limit ingress and egress to restrict side friction with adjacent lanes. Barrier separated HOV lanes (concurrent or reversible) are typically accessed using grade-separated ramps which can provide controlled access for vehicles connecting with park-and-ride lots and transit centers. In this way, access treatments can have the time savings benefit of avoiding freeway interchanges burdened by other traffic. Typical examples are shown in Figure 13 and Figure 14. Another important application of direct access ramps is connecting one managed lane to another in a regional system.
Figure 13: Direct Access Ramp to Concurrent HOV Lanes, Seattle, Washington (courtesy Sound Transit)
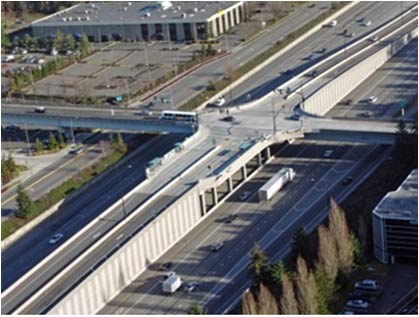
Figure 14: Direct Access Ramps to a Reversible Lane, Houston, Texas (courtesy of Texas Transportation Institute)
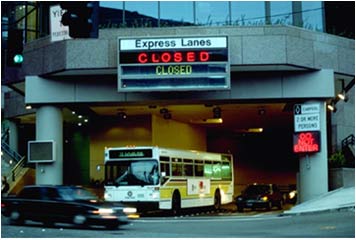
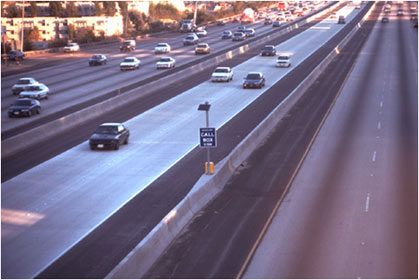
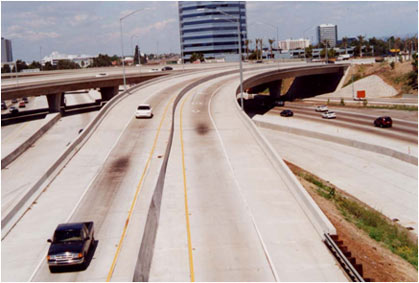
There are a variety of terms applied to managed lanes employing pricing which are highlighted on the next page. The term "express lanes" has commonly been used for decades to refer to freeway lanes that are segregated from general purpose traffic and are set apart by limiting access to them (Figure 15). Express lanes may operate bi-directionally as a dual-dual roadway like the Dan Ryan Expressway in Chicago, or they may be reversible (also known in Europe as tidal flow lanes). The reversible lanes on I-5 in Seattle and I-94 (Kennedy Expressway) in Chicago employ gated access ramping as the sole tool to manage flow into and out of the lanes. Express lanes have a reduced number of entry and exit locations as compared to the general purpose lanes. Most of the express lanes or roadways designed into freeways are not actively managed; they rely on the access design to ensure better flow. By limiting the number of access points, demand is metered into the lanes. Some access ramps, like those on I-5 in Seattle, are restricted to HOVs- to give preference onto the express lanes (Figure 16).
Figure 15: Reversible Express Lanes on I-5 North, Seattle, Washington
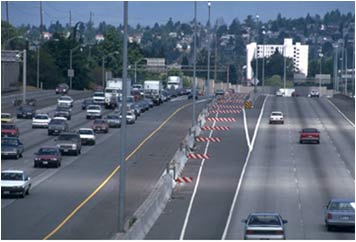
Figure 16: HOV Direct Access Ramp, Seattle, Washington
The term "express lanes" is increasingly being used to refer to all limited access managed lane facilities that provide an enhanced level of service through pricing (see subsequent section on HOT lanes), and the new 2009 Manual on Uniform Traffic Control Devices (MUTCD) recognizes this identifier for all such facilities on signing.
Definitions
Managed Lanes: A limited number of lanes within an expressway cross section where multiple operating strategies are utilized, and actively adjusted as needed, for the purpose of achieving pre-defined performance objectives (Managed Lanes. Federal Highway Administration, FHWA, Managed Lanes: A Primer. FHWA-HOP-05-031, 2008).
Express Lanes: All types of limited access expressway lanes or roadways which are often separated from adjacent general purpose lanes. HOV lanes with limited access employing tolling are also called "express lanes" on signing (Manual on Uniform Traffic Control Devices (MUTCD), Federal Highway Administration, Washington, D.C., 2009)
Express/Toll Lanes: Limited access expressway lanes or roadways separated from adjacent general purpose lanes and employing payment of tolls to manage demand.
High-occupancy/Toll (HOT) Lanes: HOV lanes that allow lower occupant vehicles that do not meet occupancy restrictions established for a HOV lane to use it through payment of a toll (FHWA, A Guide for HOT Lane Development, 2003. Accessed June 26, 2010).
High-occupancy Vehicle (HOV) Lanes: HOV lanes are intended to maximize the person-carrying capacity of the roadway by altering the design or operation to give preference to carpools, vanpools and buses (NCHRP Report 414: HOV Systems Manual. TRB, National Research Council, Washington, D.C., 1998).
Truck lanes: Lanes or roadways which primarily serve trucking needs, although general purpose traffic may be permitted to use these lanes. These facilities may employ tolling.
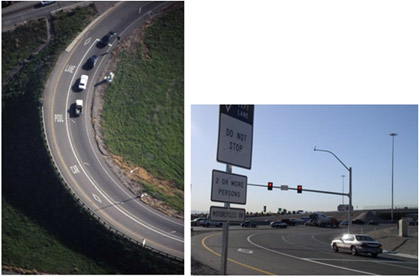
HOV and bus-only ramp meter bypasses represent the most widely applied form of HOV lane treatment, found on a majority of freeway ramps in metropolitan areas like southern California. This operational strategy is used to provide priority treatment for HOVs at metered freeway ramps and in some cases, metered freeway connectors (Figure 17). Typically, this is accomplished by providing a separate lane on the ramp which allows HOVs to bypass the queue that forms as a result of metering. HOV ramp lanes can also be metered, but at a more relaxed rate so HOVs are still offered a time savings. HOV bypass ramps can also be successful at mitigating queue spillbacks at ramps by increasing the capacity and discharging vehicles at a faster rate.
Figure 17: Examples of HOV Ramp Meter Bypasses on Freeways
Electronic pricing is an appealing component of a managed lane strategy for several reasons. First, pricing serves as a tool to fine-tune managed lane strategies that rely on eligibility and access restrictions. These restrictions alone do not always ensure the most efficient allocation of managed lane capacity as demand changes over time. Furthermore, electronic toll collection technology allows for collection without the delays, costs and space requirements associated with manual toll collection. Another reason for interest in pricing is the potential to generate revenue that can be used to augment costs of operations and possible capital recovery that would otherwise be afforded using existing revenue sources.
Pricing strategies on managed lanes can take on several forms listed below:
The first two pricing strategies listed above are often referred to as congestion pricing, but the terms value pricing and variable pricing have also commonly been used. Congestion pricing charges users more during congested peak periods and uses the power of the market for shifting demand from rush hour trips to other modes or to other less congested times of the day (FHWA, Congestion Pricing Primer. FHWA-HOP-08-039, 2008). Congestion pricing can also help ensure a high level of service on a managed lane facility by allowing the toll to vary based on typical or real-time traffic conditions. The flat toll and flat rate pricing options do not provide the same level of management flexibility, but are easier to implement, may address other needs, and have served as a preliminary step toward the adoption of congestion pricing on facilities in San Diego and Salt Lake City.
Pricing as a managed lane strategy has other benefits. In addition to incentivizing travel during off-peak periods, toll policies on managed lane facilities can also encourage transit and carpool use by providing free or discounted travel for these modes. Also, charging users a toll has the potential to generate a revenue source that can be used locally to finance operations costs and fund future improvements. It should be emphasized, however, that the primary goal of pricing on managed lanes is to ensure efficient operations. The potential for and magnitude of revenue generated by a project is dependent upon a multitude of factors which should be analyzed carefully to ensure any financial goals of a project are feasible.
In a historic context, pricing has typically been applied as a tool on HOV lanes to utilize existing capacity that is available either as a result of underuse or changes made in creating capacity, such as widening the existing HOV facility or raising occupancy rules. This strategy, referred to as High-Occupancy/Toll (HOT) lanes, allows lower occupant vehicles that do not meet occupancy restrictions established for a HOV lane to use it through payment of a toll. The toll is set to ensure that the lane remains free flowing. In this way, HOT lanes give drivers the option to pay for reliable and time-saving travel or to continue to travel on the general purpose freeway lanes. The term Express Lane is applied to address all projects that incorporate lane pricing including HOT lanes, at least on signing to help address consistency in how motorists see and use these lanes, since all projects of this type restrict access in order to toll users at specific locations. Although HOT lanes have traditionally permitted all designated HOVs to go free, some recent applications have investigated charging lower two-occupant carpools, or potentially charge all HOVs a reduced toll as is now applied on Bay Bridge HOV bypass lanes. All HOT lane projects currently in operation allow either 2+ or 3+ HOVs free use with some conditions such as a requirement to carry a transponder. Links to project websites are provided on the next page.
Example websites where HOT lane projects provide information include the following (accessed December 2010):
Carpool Preference Combinations |
HOV 3+ |
||||||
|---|---|---|---|---|---|---|---|
Free 24/7 |
Free Peak Periods Only |
Free Off-Peak Periods Only |
Discount Peak Only, Pay All Other Times |
Pay 24/7 |
|||
HOV 2 |
Free 24/7 |
I-15 (CA) I-110 (CA) (Pending managed lane facility as of September 2010) I-680 (CA) I-25 (CO) I-394 (MN) I-35W (MN) I-15 (UT) SR 167 (WA) |
|||||
Free Peak Periods Only |
I-10 (TX) |
||||||
Free Off-Peak Periods Only |
I-10 (CA) (Pending managed lane facility as of September 2010) US 290 (TX) |
||||||
Discount Peak Only, Pay All Other Times |
I-30 (TX) (Pending managed lane facility as of September 2010) I-635 (TX) (Pending managed lane facility as of September 2010) |
||||||
Pay 24/7 |
SR-91 (CA) I-95 (FL) I-595 (FL) (Pending managed lane facility as of September 2010) I-495 (VA) (Pending managed lane facility as of September 2010) I-95 (VA) (Pending managed lane facility as of September 2010) I-395 (VA) (Pending managed lane facility as of September 2010) |
TBX (FL) Lp 1 (TX) (Pending managed lane facility as of September 2010) |
|||||
Interest in HOT lanes has been growing in recent years for a variety of reasons. HOT lanes have been implemented in seven states and are being considered by metropolitan transportation agencies and state departments of transportation around the country (Figure 18).
Figure 18: Locations of HOT Lane Operations in the US as of December 2010
The use of electronic collection permits tolls to be collected from users with minimal disruption to travelers. Some of the benefits associated with HOT lanes include (Goodin, G., and L. Gray. Getting Started with High-Occupancy Toll Lanes: Lessons Learned from the Industry Leaders. Publication FHWA-HOP-09-052. FHWA, U.S. Department of Transportation, 2009):
The first HOT lane project involving adapting an existing HOV lane was I-15 in San Diego, California (Figure 19). The eight-mile long project originally built in the late 1980s was a good candidate because it operated as reversible lanes behind concrete barriers, allowing for the implementation of one tolling zone to address all users. The introduction of pricing started simplistically as a "decal" program allowing single occupant drivers to purchase a windshield decal for unlimited use on a monthly basis. Electronic toll collection was subsequently deployed through the use of windshield mounted transponders, and then a much more ambitious program was undertaken to expand and lengthen the project.
Figure 19: I-15 Express Lanes, San Diego, California
Some HOT lane projects have incorporated the ability to vary toll levels based on real-time traffic conditions. These projects rely on monitoring equipment such as loop detectors to collect traffic data on the general purpose lanes and/or HOT lane(s). Computer algorithms are then used to raise or lower the toll rate to achieve specified conditions. Most often, the algorithms are programmed to vary the toll rate to ensure a target speed is maintained on the HOT facility. When speeds begin to drop due to increased traffic volumes, toll levels increase to discourage more drivers from entering the lane. Conversely, toll levels are lowered when traffic levels on the HOT facility are low to encourage more drivers to switch from the general purpose lanes. The I-394 and I-35W MnPass Express Lanes in Minneapolis, Minnesota, are examples of facilities that vary tolls in real time. (See case study at the end of this chapter for more information.)
Express Toll Lanes (ETLs) are another example of a lane pricing strategy. ETL is similar to HOT lanes except that all vehicles are charged a toll to use the lane. These facilities are essentially access restricted tollroads within the freeway right-of-way that are actively managed to preserve free-flow operating conditions. Enforcement is simplified for ETLs. Just like a traditional toll facility, every vehicle must pay, thus the enforcement centers around toll evasion. Enforcement can be automated through license plate readers. Business rules dictate whether those that are detected as not paying will be sent an increased toll charge or a violation notice. ETLs offer a much greater opportunity for revenue generation to be used as a source for repayment of capital costs.
The first newly constructed toll express lane to be introduced in the US was the SR-91 Express Lanes in Orange County, California. This ten-mile project was constructed in an available median and includes four managed lanes (two in each direction) surrounded by eight general purpose lanes. The managed lanes are separated by a painted four-foot buffer and pylons (see Figure 19). Access to the lanes is provided only at the termini to provide express service to long distance travelers traveling through the Santa Ana Canyon between Orange and Riverside Counties. All vehicles are required to carry toll tags to use the lanes. Vehicles with three or more occupants are able to use the facility for free during off-peak hours and at a 50 percent discount during the most congested peak hours. Tolls on SR-91 vary according to a published schedule, with the highest tolls being charged during the morning and afternoon peak periods. Each project has unique business rules to address the corridor and market needs. For SR 91, the toll policy allows tolls to be increased for any time period designated as a "Super Peak" hour (Orange County Transportation Authority, Accessed June 26, 2010.). If traffic volumes are consistently above the predetermined Super Peak levels then tolls can be raised, provided that travelers are notified ten days in advance.
Figure 20: SR-91 Express Lane, Orange County, California
(courtesy Orange County Transportation Authority and California Department of Transportation)
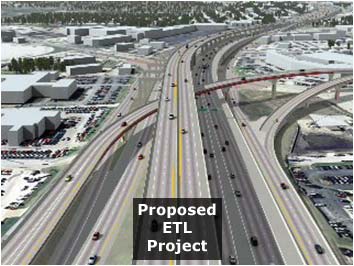
The North Tarrant Express in Dallas-Ft Worth is an example of an ETL project currently under development that will be mostly elevated above the existing freeway (Figure 21).
Figure 21: Express Toll Lanes on SH 183/I-820, Ft Worth, Texas (courtesy of North Tarrant Express)
Outside the boundaries of dedicating specific lanes for aggressive management, many freeways overseas aggressively manage all freeway lanes using a variety of ITS-oriented tools just now being adopted in the US. These tools are briefly explained in the following section and include:
Variable speed limits (VSL) are intended to manage traffic flow to improve safety and congestion relief by gradually adjusting the speed limit in reaction to factors such as traffic conditions, weather conditions, construction or maintenance activities, and other factors. With the exception of school zones on arterials and a few weather-based applications, use of variable speed limits in the US has been limited, although many transportation agencies have expressed interest in them. Results from European applications have proven to be positive and have spurred the recent development of similar applications within the US in Minneapolis and Seattle. Results from these two early applications will provide more details on concerns over compliance, enforcement, safety benefits, and operational benefits. More information on U.S. applications can be found in the following FHWA synthesis report).
Speed limits that are responsive to changing conditions are more credible and may result in improved compliance based on international experience. In certain conditions, the posted speed limit may be too high for prevailing conditions, and a variable speed limit can provide added safety.
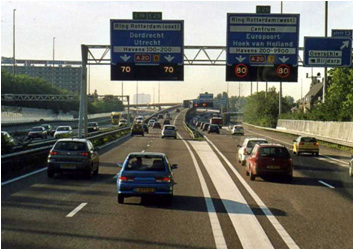
Variable speed limits (VSL) use traffic speed, volume detection, weather information and road surface condition technology to determine appropriate speeds at which drivers should be traveling, given current roadway and traffic conditions (Robinson, Mark, Examples of Variable Speed Limit Applications, Speed Management Workshop, TRB 79th Annual Meeting, January 9, 2000). These advisory or regulatory speeds are usually displayed on overhead or side mount changeable message signs (CMS) (see Figure 22). In the U.S. VSL are deployed in Colorado, Massachusetts, Minnesota, Missouri, Nevada, New Jersey and Washington State. Often VSL are part of larger incident management, congestion management, weather advisory, or motorist warning systems. In European countries the VSL installations may be advisory or regulatory in nature (Figure 23). (See case study at the end of this chapter for more information). If regulatory, electronic sensors and overhead cameras can capture license plates of errant drivers and citations can be issued by mail.
Figure 22: Variable Speed Limit Sign with Lane Controls, Seattle, Washington
(courtesy Washington State Department of Transportation)
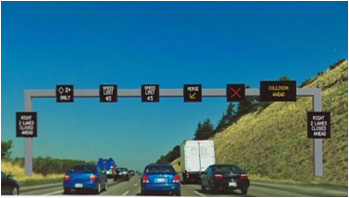
Figure 23: Variable Speed Limit by Lane, Rotterdam, Netherlands
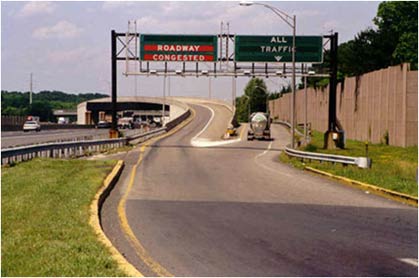
An example deployment is on the New Jersey Turnpike where enforceable variable speed limit signs have been in use since the late 1960s to provide early warning to motorists of slow traffic or hazardous road conditions. Approximately 120 signs are installed over 148 miles of roadway. The posted speed limits are based on average travel speed and are displayed automatically (manual override used for lane closures and construction zones). The posted speed limit can be reduced from the normal speed limit in five-mph decrements, to 30 mph. The posted speed limit can be reduced for six reasons: accidents; congestion; construction; ice; snow; and fog. The speed warning signs display, "Reduce Speed Ahead" and the reason for the speed reduction. When appropriate, the distance between the warning sign and the beginning of the congestion is displayed on the dynamic warning sign that otherwise provides guidance to one of the two roadways (Figure 24). The New Jersey Turnpike Authority believes that the signs are effective and provide motorists with information on unusual roadway conditions that dictate the need for speed reduction. State Police enforce the reduced speed limits by issuing summonses to those motorists found to be in violation.
Figure 24: New Jersey Turnpike Queue Warning Signage at Ramp (courtesy New Jersey Turnpike Authority)
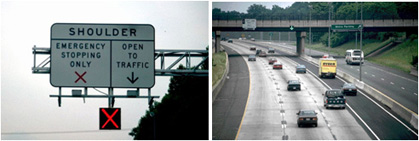
Lane-use control signals (LCS) are fixed-grid changeable messages signs that use both color and pictogram symbols to convey information. The 2009 MUTCD defines LCS as special overhead signals that permit or prohibit the use of specific lanes of a street or highway or that indicate the impending prohibition of their use. LCS's are most commonly used for reversible-lane control, but are also used in non-reversible freeway lane applications. Other applications can include (Finley, M.D.; G. L. Ullman; K. D. Parma; and N. D. Trout. "Yellow Transition Lane Control Signal Symbols for Freeway Traffic Management." Transportation Research Board Paper 01184. Transportation Research Board Meeting, Washington, DC, January 2002, Ullman, G. "Motorists Interpretations of MUTCD Freeway Lane Control Signals". Texas Transportation Institute, January 1993):
In addition, some agencies use LCS to indicate to motorists that a breakdown shoulder can be used as a travel lane during peak travel periods. I 66 in Virginia uses the left most lane as an HOV lane during the peak periods; therefore, the breakdown shoulder is used during this period to allow the same number of general purpose lanes for traffic. The priced dynamic left shoulder lane (PDSL) on I-35W in Minneapolis also uses LCS to indicate when the shoulder lane can be used by designated traffic (Figure 25). In Virginia I-66 allows inbound traffic to operate in the right shoulder when HOVs simultaneously use a left general purpose lane during peak periods (Figure 26). (See Section 8.8.3 case study for more discussion of this project.)
Figure 25: Lane Control Signal over I-35W PDSL, Minneapolis, Minnesota
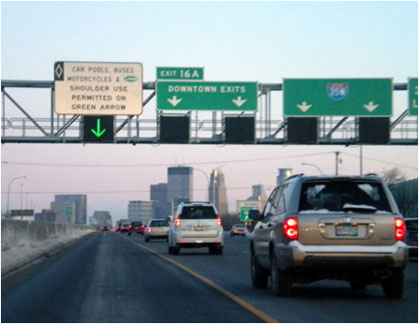
Figure 26: Lane Control Signal on I-66, Virginia Signage over right shoulder lane (left) with leftmost lane restricted to HOVs (right)
The number and directionality of freeway lanes and shoulders can be dynamically managed to serve variable traffic patterns. Common examples include:
A contraflow lane is a freeway lane in the off-peak direction of flow (normally adjacent to the median) that is designated for use by buses or HOVs traveling in the peak direction for a portion of the day (Figure 27). Normally, the contraflow lane is separated from the off-peak (or opposite) flow by insertable pylons or movable concrete barriers. In the off-peak, pylons are removed or the barrier is stored next to the median, so that the lane configuration returns to its normal condition. Contraflow offers the opportunity to gain another peak direction lane with rather low capital cost, if an off-peak lane(s) can be borrowed and not degrade the off-peak direction.
Figure 27: H-1 HOV Contraflow Lane, Honolulu, Hawaii (courtesy Hawaii Department of Transportation)
Reversible lanes are dedicated freeway lanes that serve directional peak period demands (i.e., inbound morning trips and outbound afternoon trips). These lanes are physically separated from general purpose lanes and typically operate on a set schedule to provide consistency for travelers and operators.
Dynamic shoulder lanes, such as those on the I-35W PDSL, allow use of the hardened shoulder (either left side or right side) for use by traffic during peak periods. These shoulder lanes are implemented concurrently with lane control signals and often with variable speed limits. Appropriate measures should be used to make sure all stored vehicles are removed from the shoulders prior to opening them to traffic.
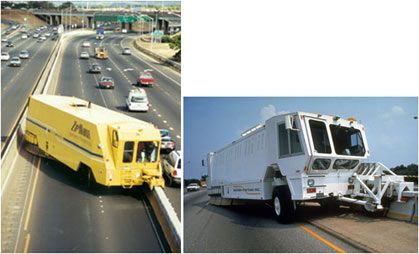
Many dynamic lane applications on bridges and tunnels, including contraflow lanes, employ moveable barrier technology to control traffic and minimize head-on collisions. Moveable barriers also tend to keep the dynamic lane speeds at free flow conditions, thus providing lane users with time savings. Moveable Barrier Technology (MBT) provides the opportunity to change the direction of a freeway lane while providing continuous positive protection between opposing flows of traffic (Figure 28). MBT can accomplish these changes quickly, making it possible to respond to changes in traffic volumes that occur within a day. Therefore, MBT provides a strategy to change the capacity of a freeway in the peak direction quickly and easily, with a resulting reduction in congestion (Rathbone, Daniel B, Moveable Barrier Assisted Traffic Management To Mitigate Congested Highways, Bridges and Tunnels, DBR Associates, August, 1999).
Figure 28: Moveable Barrier Technology in Honolulu, Hawaii and Dallas, Texas (left photo courtesy Hawaii Department of Transportation)
Metering refers to the use of traffic signals to control the flow of vehicles. This strategy is most often used to manage the flow of vehicles coming onto a facility at on-ramps, but it can also be used to manage traffic on the facility mainlines. This topic is covered in Chapter 7.
Historically, both US and European experience has seen isolated experimentation with active management of ramps beyond more traditional ramp metering. For closing local access ramps during peak demand periods, gates of one sort or another have been applied to dynamically perform this function. For interchanges, the downstream balance between mainlane and connector merges may justify closing lanes on one approach upstream to ensure better merging (Figure 29).
Figure 29: Example of Junction Control Illustration from Europe (courtesy of the FHWA 2006 scan tour of managed lanes in Europe)
These approaches to ramp and merge management are typically site-specific and work in conjunction with other active management strategies in promoting better throughput and safe merging. Such examples found from past U.S. freeway experiences are shown in Figure 30.
Figure 30: Junction (left) and Ramp Closure Controls (right)
In operating managed lanes, each of the tools previously presented play both unique and interrelated roles. These include vehicle and user classification, operation period and managing access, and pricing.
Traditionally, managed lanes focusing on promoting person movement (i.e. HOV lanes and bus lanes) have appropriately restricted use based on vehicle and user eligibility. Operating a managed lane based primarily on user restrictions has been and continues to be the most commonly practiced approach in the US, Canada and overseas. This approach also has held the greatest promise in getting more commuting efficiency out of a single lane of pavement and in promoting modal shifts. While a lane restriction by vehicle and user classification may not be responsive to real-time and changing traffic conditions, it is considered relatively easy to enforce, exhibits a low cost to operate and has the longest track record historically (Figure 31).
Figure 31: Lane Restrictions based on Eligibility
In congested settings all available lanes have an important contribution and utility to the transportation network. While lanes dedicated to specific vehicles and users may meet high levels of performance, if they appear empty even during limited periods, public and political credibility in the investment can be lost or eroded over time. Therefore, developing an operating philosophy that is flexible in setting hours of operation, as well as occupancy requirements is important to effectively manage the facility. It has to be realized that both hours of operation and occupancy requirements cannot be changed in real time. To maximize modal and route shift opportunities, both have to be set and established such that drivers know what they are prior to leaving for a trip. It should also be recognized that changing either of these parameters can also have a profound change in the operations of the facility. Thus it is important to have in place a policy for making changes, but in practical terms changes should be rather infrequent.
Transit is one of the biggest beneficiaries for managed lanes, regardless of whether the lanes are operated as a busway, HOV, HOT, or ETL. Any of these strategies offer a reliable trip that is advantageous for transit use and schedule adherence. The level of friction associated with other modes, both enroute and on the downstream (employment) end of the trip regarding parking cost and availability, can drive mode shifting if transit service meets market needs and is quick and convenient. This often means introducing or augmenting express bus services and park & ride facilities in conjunction with freeway managed lane treatments.
HOV lanes and transportation demand management (TDM) have a very complimentary (and in many cases required) relationship insofar as providing a dedicated roadway facility to move carpools and vanpools and having programs that help form and sustain them. Conversely, relying on other forms of transit investments and not providing facilities that encourage carpooling and vanpooling for employment not easily served by transit misses an important component in an overall TDM and congestion management program. For example, it is hard to expect vanpools and carpooling to be as successful with only a preferential lane incentive unless preferential parking, ridematching services, financial incentives, employer outreach and related programs are in place to encourage mode shifting. Many successful examples exist in Houston, Minneapolis, Virginia and Seattle where average vehicle occupancies (AVO) in affected corridors have climbed from 2.3 to 2.9 or higher as a result of such synergistic programs. Without such treatments and programs, similar corridors in these cities have seen no such changes in AVO rates.
Determining operation periods and managing access often go hand in hand. This is because a part-time managed lane operation reverts back to general purpose freeway use during parts of the day, making it necessary that all freeway lanes during these periods look and function the same. Otherwise, driver confusion becomes a concern, and this may result in erratic movements that could adversely affect safety.
Operating periods for managed lanes often vary in two primary ways. They either target operation restrictions to peak periods of demand and open to all traffic at other times; or they are open during most daylight hours, if not on a 24/7 basis. Good policy principles support both approaches, and there are widespread examples of both throughout the US as noted in Figure 32 below, which compares operation hours on all managed lane projects over a 30-year period. About the same number of projects has historically supported full time operation as part-time which is largely oriented to peak commute periods only. However, the facility design plays a role in whatever approach is taken.
Figure 32: Comparison of Operating Periods for Managed Lanes, 1970-2000 (Fuhs, Charles and Jon Obenberger, "HOV Facility Development: A Review of National Trends," published in "HOV and Demand Management 2002," Transportation Research Record No. 1781, Transportation Research Board, Washington, DC, 2002)
Targeting a designated peak period provides the managed lane benefits when it is most needed, thereby reducing operation cost and enforcement presence outside these periods. But in so doing, lane benefits cannot be realized for non-recurrent events. If the off-peak period is not congested, then there is not a strong rationale other than presence of an empty lane syndrome that can influence why general flow traffic should need the lane. There are other factors including facility design that can influence the selection of a particular operation period. For example I-77 in Charlotte reflects a 24-hour operation since a portion of the concurrent HOV lane configuration separates from the mainlanes to circumvent an interchange, and allowing general purpose traffic to use the leftmost lane during non-operating periods would have created a potential safety concern by confused motorists where roadways split.
Access into and out of the managed lane should be continuous for part-time operation because the lane serves general traffic. For full time operations, access can be either open or restricted to designated locations. Historically, about 60 percent of HOV lane-miles in the US have been unrestricted or open access, and the other 40 percent have restricted access to designated weave zones largely through pavement markings (Fuhs, Charles and Jon Obenberger, "HOV Facility Development: A Review of National Trends," published in "HOV and Demand Management 2002," Transportation Research Record No. 1781, Transportation Research Board, Washington, DC, 2002). Various safety studies conducted through the years suggest that both approaches to access can be safe and function well. Some access restricted managed lanes are moving toward open access in southern California, while adding tolling to other HOV lanes is creating the need to restrict access between toll zones. Justifications supporting access restrictions include the desire or need to control ingress and egress at designated locations, reduce unnecessary weaving, discouraging short distance trips from using the lanes and limiting violations by queue jumpers. Justifications for allowing open access include allowing greater flexibility in use and allowing weaves and merges to occur at any location.
Pricing can address many different objectives including increasing vehicle throughput (without adversely impacting person movement goals), cost recovery for improved incident management and enforcement, revenue generation for other transportation improvements, improved real-time management on a lane that otherwise relies on eligibility and access restrictions and better public perceptions of utility and equity of use. However, introducing electronic pricing can be politically divisive and can be costly both from a capital and operation/maintenance perspective, particularly for single managed lane settings. The level of use, nature of demand and costs to implement need to be weighed as issues to determine a best strategy. Goals need to be clearly communicated.
The first pricing demonstrations dating from the mid 1990s have been well documented in various case studies (Sullivan, E. Evaluating the Impacts of the SR 91 Variable-Toll Express Lane Facility: Final Report. Department of Civil and Environmental Engineering, Cal Poly State Univ., San Luis Obispo, California, 1998, Supernak, J., Golob, J. Golob, T.F., Kaschade, C., Kazimi, C., Schreffler, E., and Steffey, D. San Diego's Interstate 15 Congestion Pricing Project: Attitudinal, Behavioral, and Institutional Issues. In Transportation Research Record, No. 1812, Transportation Research Board, Washington, D.C., 2002, pp. 78-86, Burris, M.W., and B.R. Stockton. HOT Lanes in Houston: Six Years of Experience. Journal of Public Transportation, 2004) with supporting guidance in several treatises (FHWA, A Guide for HOT Lane Development, 2003. Accessed June 26, 2010). Most early demonstrations took several attempts to obtain public support, and following implementation were generally well accepted based on survey data. Various issues, including where excess revenue is expended, who uses the lanes and associated socio-economic equity concerns, and impacts on transit and ridesharing have been tracked and documented. Most early projects added pricing to existing HOV lanes that were barrier separated and had available capacity to toll. A wide array of business rules have been applied to each project affecting who is free and who pays, how tags are administered, when lanes are open and how transactions are processed and debited from user accounts. These terms of operation need to be carefully considered in light of potential unintended consequences. For example, I-25 in Denver sets minimum toll rates in peak periods such that toll users would not be paying less than transit users. Revenue leakage and violations have been reduced through applications of back-up license plate recognition (LPR) systems common to many tollroads and use of permanently placed pylons to separate the parallel traffic streams.
When applied as a managed lane strategy, operational parameters for pricing can be implemented in a variety of ways. Not all pricing strategies are suitable in all settings as each project has specific operational, logistical, institutional, and attitudinal barriers associated with it. Therefore, a feasibility study must be undertaken prior to implementation to analyze each of these components and choose the pricing regime that is likely to be the most successful. The following tasks are typically conducted as part of the pre-implementation efforts associated with a pricing project:
Because managed lanes require adherence to access, eligibility, and pricing restrictions, effective enforcement policies are necessary to ensure these facilities operate as desired. The ability of a managed lane facility to offer improved travel conditions can be compromised without an appropriate enforcement program. Most successful managed lane projects incorporate a variety of enforcement strategies that may require specific design, tolling or ITS capabilities. The specific strategies chosen depend largely on the design and operational characteristics of the facility. For example, the types of enforcement strategies that are effective and appropriate for concurrent flow HOV lanes may not be needed or appropriate for barrier separated facilities. The type of offenses and goals for managing each may vary. For HOV lanes, an accepted goal or "rule of thumb" for many projects has been a 10 percent occupancy violation rate. Buffer separated facilities may have a recurring problem of violators crossing the buffer on a restricted access facility. Speeding and other offenses may need to be monitored. Pricing projects allows the back office to address toll evasion through LPR, but officers in the field need to know who has paid in order to manage occupancy offenders. Different tactics are appropriate for each type of offense, and each police agency has preferences established through their other traffic management duties.
Enforcement can be classified into four approaches (Cothron, S., D.A. Skowronek, and B.T. Kuhn. Enforcement Issues on Managed Lanes. Research Report 4160-11, Texas Transportation Institute, College Station, TX, 2003):
Figure 33: Example of Enforcement Strategies (routine enforcement-left, self-enforcement-right)
Enforcement strategies are made more complicated with the augmentation of pricing. Provisions for supporting legislation, enforcement staff availability, complexity of operation rules and design provisions that allow for ease of monitoring and apprehension need to be addressed. The ability to sort out who is a free HOV user versus a paid customer needs to be easily and rapidly communicated to the officer in the field. Currently no technology has received acceptance from respective policing or court systems that can definitively communicate the number of occupants in a vehicle. This level of automation, if ever adopted, is not a near term option. So the various strategies to address enforcement roles needs to account for the respective business rules, police agency preferences and facility design that can accommodate these requirements. Police presence in the field is an underlying benefit to user compliance, but all regulations will exhibit some level of violations.
Current practice is to provide monitoring for police in the vicinity of each toll zone. Early priced projects on SR 91 in Orange County (California), I-15 in San Diego, I-25 in Denver and I-10 in Houston included rather elaborate self declaration lanes for separating, tolling and monitoring free HOVs from other tolled traffic at tolling points. Most recent projects have dispersed with this capital intensive strategy and focused more on business rules and strategies giving police more electronic tools to enable them to determine potential violators.
Other operational considerations of pricing on an existing HOV lane or proposed lane being added include not only the tolling strategy, but also addressing the intended level of demand and guaranteed service being offered. Typically the volume of traffic will be increased based on infilling available lane capacity if a conversion, since optimizing throughput is typically a prerequisite goal. This means that managing lane operations requires that supporting functions are able to address minor and major incidents in a responsive fashion and that the integrity of operation is preserved to assure proper revenue collection. Incident management, enforcement and maintenance services play particularly important roles.
Traditionally on HOV lanes, these roles are embedded within the context of overall freeway operations, and few such managed lanes have dedicated services or frequencies of response different from any other lane. Increasingly, priced lanes are being given priority and revenues collected are applied to pay for this preferential level of attention. Dedicated enforcement presence often under contract assures a high level of compliance. Incident management may entail more frequent remote detection and dedicated backroom monitoring. Maintenance, particularly for mission critical tolling systems and motorist communication, may require a very high reliability with performance responsiveness within an extremely short timeframe. All such aspects frame the overall operational considerations for a priced lane. These aspects are acutely more critical to address in an urban setting where the managed lane may not have the benefit of all the desired geometric design features accommodated on traditional toll roads—where breakdown shoulders may not exist or where sight distances are limited. For example, debris blocking the managed lane located next to the median barrier is more likely to pose a hazard for high volumes of traffic and thus, pose the potential to create a disruption to flow and LOS. Generated revenues are often used to address these shortcomings by commensurately addressing and dedicating responsiveness capability of enforcement, incident management and maintenance forces.
This section provides a brief overview of the various issues that should be considered when designing managed lane facilities. Managed lane strategies are intended to be highly specific and adaptable for a broad range of project settings and designs reflect this wide range of operational needs. Therefore, only the AASHTO "Green Book" (AASHTO, A Policy on Geometric Design of Highways and Streets "Green Book," 2004 and subsequent updates) guidance for standard lane and shoulder widths in freeway settings represents best practice. There are various relatively recent sources for specific HOV design applications pertaining to concurrent, reversible and contraflow design practice (NCHRP Report 414: HOV Systems Manual. TRB, National Research Council, Washington, D.C., 1998, AASHTO, Guide for High-Occupancy Vehicle (HOV) Facilities, 2004, Institute of Transportation Engineers, Freeway and Interchange Geometric Design Handbook, Chapter 13, 2005), but there is limited available design guidance that is specific to other specific managed lane elements such as pricing. Further, since a vast majority of managed lane designs have been implemented onto existing freeways in constrained design settings, few projects have been able to address all of the desirable design attributes in a cost feasible manner and difficult trade-offs have been required. Many project designs reflect these compromises. Since all have operated safely and perform reasonably well in meeting their stated operational objectives, there are few "best practices" that are nationally transferable. In many places regional standards of design practice have emerged influenced by operation needs, design constraints and driver expectations (and conversely resulting from driver behavior to the adopted designs).
Each element of a managed lane project should be designed to achieve specific operational goals and fit within the context of a particular design setting. Considerations should also be made to ensure that all design elements work in concert to achieve regional consistency and efficiency. The following design considerations are common to the implementation of managed lanes:
Almost all managed lanes are located on the left side next to the median such that long distance travel with limited access is facilitated. Long distance trips are more amenable to generating the time savings needed to create demand. Traffic, right-of-way, existing roadway infrastructure and cost considerations generally dictate the design of dedicated roadway facilities. A left side orientation results in fewer conflicts with mixed traffic since there are few locations were left side ramps intervene. A right side orientation frequently conflicts with local on- and off-movements with the mainlanes, so therefore, either the usage of right side orientations needs to be low to mitigate the magnitude of conflicts, or usage must be restricted to select drivers and vehicles such as buses only (see Figure 34 and 35 for examples).
Figure 34: Right Side HOV Lane on SR 520, Bellevue, Washington
Aside from ramp queue bypasses, left side oriented facilities generally fall into one of the following categories:
Figure 35: Right Side HOV Lane on I-405, Bellevue, Washington (since reconfigured on left).
A comparison of trends among HOV lanes for each of these categories can be found for prior years in Figure 36. At least half the concurrent flow lanes in the US have been buffer-separated, and as more lanes are priced, this percentage is expected to increase. Dating from the mid-1980s, concurrent flow lanes (buffer separated and non-separated) represented at least half of all lane-miles, and over time they have become the dominant design. Reversible flow and contraflow designs today represent a small and shrinking fraction (less than 15 percent) of all managed lane designs (Fuhs, Charles and Jon Obenberger, "HOV Facility Development: A Review of National Trends," published in "HOV and Demand Management 2002," Transportation Research Record No. 1781, Transportation Research Board, Washington, DC, 2002, California Department of Transportation, "HOV Guidelines", 2003).
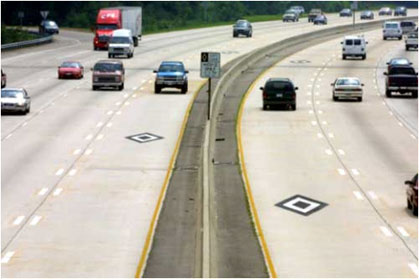
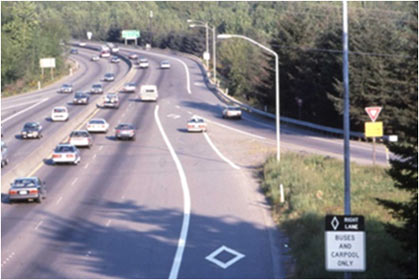
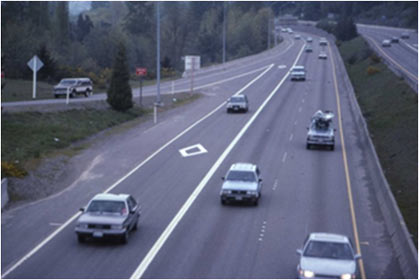
Concurrent flow facilities operate in the same direction of travel. For part-time operation they often take the form of a leftmost general purpose lane that is restricted for use by eligible vehicles for at least a portion of the day, employing median signing and diamond pavement markings as the primary means of communicating the restrictions on use. Exceptions are a designated right side lane or shoulders that are converted to travel lanes during peak periods, as is done in Seattle and Minneapolis. Concurrent flow lanes can provide continuous access or can be separated using a physical barrier or painted continuous access buffer or buffer with designated access points. The hours of operation can also vary; the lanes can be operated full-time or can be restricted to peak periods and revert to general use during other periods.
Concurrent flow lanes are best suited to situations where peak period demand is heavy in both directions or directional demand is only addressed through a lane restriction on the leftmost lane inbound in the morning period and outbound in the evening period. From a design standpoint, concurrent flow lanes are the easiest configuration to implement since they do not require rebuilding a freeway with centerline oriented bridge columns. Also, concurrent lanes do not require complex and costly measures to control directionality throughout the day.
Figure 36: Types of Managed Lane Designs: 1983 to 2001 (Fuhs, Charles and Jon Obenberger, "HOV Facility Development: A Review of National Trends," published in "HOV and Demand Management 2002," Transportation Research Record No. 1781, Transportation Research Board, Washington, DC, 2002)
Conversely, the ease of accessing a concurrent flow lane also makes it much easier to access and to violate, complicating lane management strategies and typically requiring more police presence. Incidents in adjacent lanes can also affect a concurrent lane without barrier separation since mainlane incidents can be more effectively addressed by allowing general traffic to use the managed lane where barriers between the parallel roadways are not present.
Reversible flow lanes are most appropriate on facilities that experience large directional traffic imbalances and are forecast to do so in perpetuity. This characteristic is not found on many urban corridors. Reversible facilities are best suited for long distance trips with limited intermediate access needs along the affected route to minimize traffic disruptions (NCHRP Synthesis 340: Convertible Roadways and Lanes. TRB, National Research Council, Washington, D.C., 2004), because any access requires barrier channelization, gating or flyover structures. A directional split of 60/40 is commonly used as a threshold for the level of traffic imbalance needed to warrant a reversible facility (NCHRP Report 414: HOV Systems Manual. TRB, National Research Council, Washington, D.C., 1998). A limitation of implementing a reversible flow design is that it cannot serve congestion that may be present in the off-peak traffic direction. If such is the case, then some users, such as deadheading transit buses that need trip reliability to make a second peak direction run during the commute period, will be adversely impacted. All freeway reversible lanes must be separated by "Jersey" barriers in a high speed roadway setting (which is not the case on arterial treatments). They are typically constructed in the median of freeway facilities and may be one, two or more lanes wide. These characteristics have several associated advantages and disadvantages. A facility that changes direction to serve morning and afternoon traffic can be an efficient solution since it allocates capacity specifically to the most congested direction of travel. Reversible lanes offer a much higher guaranteed LOS for transit since side friction from adjacent traffic is removed. Some locales, notably Houston, implemented reversible lanes to address the peak direction alone since width was not available to address both directions of travel. Adapting a reversible flow lane or roadway into a freeway typically requires rebuilding most bridges with center columns.
Costs for reversible lanes may be lower or higher than other treatments that require improvements in both directions, largely based on the infrastructure that has to be negotiated. Many recent reversible lanes implemented in Minneapolis (I-394), Denver (I-25) and San Diego (I-15) were cost effective because the entire freeway was reconstructed at the same time. The I-15 San Diego managed lane extension adopted a hybrid solution that involves up to four lanes with a moveable barrier median, allowing a 2-2 or 3-1 configuration for different parts of the day.
A disadvantage of reversible lanes is the ongoing cost of daily surveillance and lane/ramp reversal activities. These treatments must be designed to prevent wrong way movements, requiring extensive and redundant ITS and traffic control device treatments for each opening, plus a staff compliment who must visually inspect the roadway prior to each opening period. Tolling and enforcement is made easier by the barrier environment in which a single field location can be identified to monitor and/or toll all traffic flow. Other unique aspects of reversible lanes require special design considerations such as:
Contraflow lanes, like reversible flow lanes, require perhaps even stronger peak period directional demand. This is because a contraflow lane borrows an off-peak direction lane(s) and converts it to peak direction operation. Therefore contraflow designs can only be implemented if there is unused off-peak direction capacity. Creating congestion in this opposing direction is not desirable nor is it publicly acceptable. Contraflow lanes are operated only during specific periods, and the leftmost lanes revert to general use otherwise. During operational periods, deployable pylons or moveable barriers are used to separate the contraflow lane from opposing traffic flows. Figure 37 shows examples of contraflow lanes where traffic is separated from opposing flow using these two design strategies.
Figure 37: Examples of Contraflow Lanes on Route 495, New Jersey and I-93, Boston, Massachusetts
Contraflow lanes are an appealing option when excess capacity allows since the cost to implement is relatively low compared to the construction of a dedicated lane. However, the ongoing operating costs associated with deploying and removing the lane before and after each peak period can potentially be significant. If moveable is employed, MBT is probably the safest approach (see previous section 8.3.2.3). Specific supporting design features including a storage garage in the median is desired for a moveable barrier design. General issues to consider when designing contraflow facilities include (Institute of Transportation Engineers, Freeway and Interchange Geometric Design Handbook, Chapter 13, 2005):
The speed differential created by managed lanes located adjacent to other lanes is perhaps the most important design aspect from a safety perspective. HOV guidelines for many years have advocated that the safest operation can result with some form of barrier separation between concurrent traffic streams, and crash rates for barrier-separated projects do bear out a better overall record than for non-separated lane treatments, all other factors being equal. Enforcement is also made easier with barrier separation.
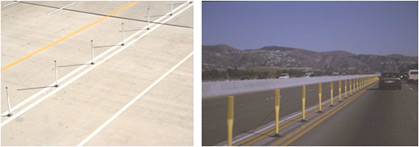
Taking away general purpose lanes for restricted use has not been politically or publicly feasible, and risks adverse impacts in early years of operation including higher levels of congestion and loss of efficiency until volumes build back. For this reason, for many projects to move forward, a softer form of lane separation was applied. The most frequently applied best practice is a narrow buffer that is nominally two to four feet wide (Figure 38). The buffer should provide enough segregation of flow to improve sight distance and if at least four feet in width, can accommodate the installation of pylons where side friction and weaving is particularly problematic (Figure 39). A buffer of six to 10 feet is not considered safe because it can be construed as a refuge area for emergency breakdowns. If separated with pylons breakdown shoulders can be considered part of the overall buffer.
The type of separation treatment used for managed lanes is dictated in part by the intended operation of the lanes. Facilities that are operated part-time and revert to general use during off-peak periods should not be separated in a way that is confusing to drivers during non-restricted periods (Institute of Transportation Engineers, Freeway and Interchange Geometric Design Handbook, Chapter 13, 2005). The majority of HOV lanes that operate part-time are separated by a painted line so that the lanes are easily accessible by general purpose traffic when HOV restrictions are not in effect. A wider than standard pavement marking in this instance is required to help differentiate the lane during its restriction.
Figure 38: Examples of Buffer Separation Treatment
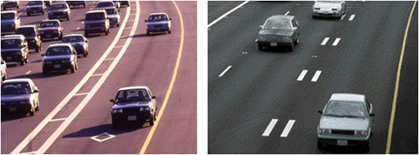
Figure 39: Examples of Pylons Placed in a Wide Buffer (left) and Narrow Buffer (right)
The degree of separation can also influence managed lane speeds, throughput and demand. An understanding of the maximum differential for various designs must be part of any determination of feasibility. Thirty years of experience has shown that without full barrier separation, the maximum speed differential to be gained in a concurrent managed lane separated only by pavement markings is about 20 mph over the parallel freeway traffic stream. Thus, if freeway traffic is moving at an average of 20 mph, the managed lane traffic stream will not likely achieve an average speed of more than 40 mph. Physical separation may be preferable for facilities that incorporate tolling to ensure that violation levels are kept to a minimum and the integrity of the facility is maintained.
The design of access points has an impact on the operating characteristics of a managed lane facility. Access to managed lanes can be unlimited (continuous) or can be restricted to designated locations. In situations where access is limited, the number, location, spacing, and type of access points are all important aspects to consider. Access considerations not only affect the performance of a facility, but also impact enforcement and safety. For example, close spacing and/or frequent access points can degrade operating conditions and impair the ability to provide effective enforcement (FHWA, Managed Lanes: A Primer. FHWA-HOP-05-031, 2008). Access on most access restricted concurrent lanes is provided at spacing less frequent than average spacing for the mainlanes.
Access spacing of two to three miles is common for most restricted access treatments. For reversible operations, access is typically much further than this, and for contraflow, the nature of borrowing a lane precludes intermediate access from being considered for safety reasons.
There are a variety of treatments that can be used for managed lane access. Access can be provided at-grade or employing grade-separated ramps. At-grade access is the most commonly used treatment, either at designated locations or open along a lane. Grade separated treatments are commonly reserved for specific high volume locations and where transit support facilities are implemented. The different access treatments typically employed are summarized below:
Figure 40: Designated Access Zone Allowing Ingress and Egress
Figure 41: Ingress Zone with a Weave Lane (Left) and Egress Zone on I-495, Suffolk County, New York (right)
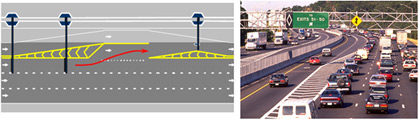
Figure 42: Slip Ramps Providing Terminal Access to Managed Lanes, Dallas, Texas (left) and Seattle, Washington (right) (Texas Transportation Institute Website on Managed Lanes)
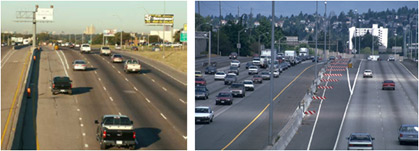
Figure 43: Median Drop Ramps (elevated-left, depressed-right) (left photo courtesy Sound Transit)
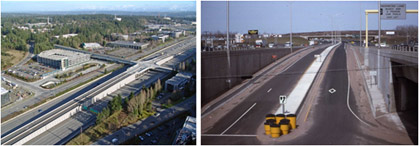
Figure 44: Freeway-to-Freeway Two-way Connector along I-5 in Orange County, California
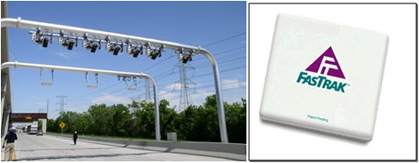
Managed lanes that incorporate pricing as a management strategy typically rely on electronic toll collection (ETC) for the collection and processing of toll payments. ETC benefits motorists by allowing them to pay tolls without having to stop and make physical transactions that would otherwise consume time savings. The basic components of an ETC system include:
To record toll transactions, ETC technology utilizes an on-board windshield mounted transponder that communicates with antennas mounted on overhead gantries. When a vehicle passes under one of these gantries, the on-board transponder is activated and sends a signal to the overhead reader (Figure 45). This signal is encoded with an identification number that is used to reconcile the transaction with the appropriate account. Enforcement is commonly aided by license plate recognition (LPR) cameras that capture the images of license plates (front and rear) for vehicles that are not read by the toll equipment. The license plate information is used to match a vehicle with an account or to identify toll violators. When proactively administered on some tollroads, LPR serves a primary means of "pay by plate" in which tolls are mailed to vehicle owners, thereby eliminating the requirement that a motorist to carry a transponder. However, pay-by-plate is a more expensive method of toll collection for administration purposes.
Figure 45: Electronic Toll Collection Gantry with LPR and Sample Transponder.
Congestion pricing requires additional infrastructure and communications abilities. Since pricing is used to maintain a specified operational threshold, the toll system needs to either be based on a schedule that reflects typical peak demand curves, or it needs to be dynamic and receive real-time traffic input to calculate the toll rate. This real-time traffic information is obtained using loop detectors or other devices capable of detecting characteristics such as traffic volume and speed. A tolling algorithm then uses these characteristics to calculate the appropriate toll to charge. The toll can be raised or lowered in response to traffic conditions as appropriate to influence managed lane operations. However, business rules need to advise customers of the prevailing toll rate. This is typically done upstream of entry points using dynamic signing elements in accordance with guidance found in the 2009 MUTCD (Manual on Uniform Traffic Control Devices (MUTCD), Federal Highway Administration, Washington, D.C., 2009) (see Figure 46). The prevailing price a customer sees when making a choice to use the lane should be guaranteed once they enter. For this reason, the tolling system design opens a customer account at the entrance point but does not process the transaction until the vehicle passes one or more downstream tolling gantries.
Figure 46: Example Managed Lane Pricing Sign from the 2009 MUTCD (Manual on Uniform Traffic Control Devices (MUTCD), Federal Highway Administration, Washington, D.C., 2009)
The implementation of pricing also requires a variety of considerations beyond the necessary tolling infrastructure. A marketing campaign is needed to inform the public how tolling will work, including hours of operations, eligibility requirements, expected toll rates, and how tolls will be collected. Customer service support staff will be needed to manage distribution of toll transponders, manage accounts, and respond to customer questions and concerns. Interoperability of toll technology implemented on a managed lane should also be considered, particularly if a managed lane is implemented in an area with existing or proposed toll facilities, or if other projects are expected to come online in the future. Interoperability requirements may also be codified in state or multi-state agreements and legislation.
Enforcement on managed lanes has traditionally been accomplished by providing designated enforcement areas. Each type of operation and design offers different approaches to accommodate these areas. On concurrent flow lanes, this approach may require the placement of enforcement areas at regular intervals by widening or designating a monitoring and apprehension area in the median, often by offsetting the median barrier. For reversible, contraflow or queue bypasses, widened shoulders are often applied (Figure 47). Concurrent flow facilities are particularly difficult to enforce since motorists have the ability to freely enter and exit at any point. Therefore, these facilities desirably require special attention to ensure compliance with managed lane policies. Separated facilities provide more of a deterrent for violators, so enforcement activities can be strategically concentrated at access points.
Figure 47: Examples of Enforcement Areas (concurrent flow-left, reversible flow-right)
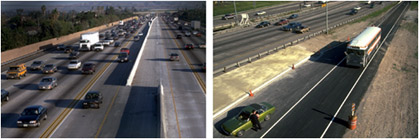
Recent technology advances have made it possible to automate some of the enforcement responsibilities related to tolling, but in-field presence is still required for occupancy enforcement if HOVs are given priority. The use of ETC for the collection of tolls requires paying users to establish pre-paid toll accounts from which to deduct toll transactions. License plate readers (LPR) capture license plate information for any vehicle that passes under a toll zone without an account or readable toll transponder, which allows operators to collect owed tolls. However, the task of enforcing facilities that offer toll-exemptions for eligible vehicles remains a challenge (Sas, M.,S. Carlson, E. Kim, and M. Quant. Consideration for High Occupancy Vehicle (HOV) to High Occupancy Toll (HOT) Lanes Study. Publication FHWA-HOP-08-034, FHWA, U.S. Department of Transportation, 2007). Most HOT facilities do not require HOVs and other eligible vehicles to carry a toll transponder, which places the burden of enforcement on visual inspection. In these situations, toll zones can be equipped with beacons that alert nearby enforcement officers when a vehicle passes through without a transponder being read. The activation of the beacon tells the officer to visually inspect the vehicle to ensure that it has the required number of vehicle occupants.
Transit design provisions vary in accordance with the intended operation plan. In general such facilities serve to collect and distribute transit patronage and typically fall into the following categories:
While local transit services may partake of a short segment of a managed lane, the vast majority of service is long-haul express bus-type operations. In this context service may be point-to-point or linked between a series of limited stops, at least in the off-peak period. Seldom does transit station frequency mimic that of light rail or even local service BRT. Point-to-point service may be 20 or more miles in length, and may serve several major employment destinations. As such, stations are often hubs that connect to other local services enroute or at a terminus within a major employment center. Stations are designed and sized to the specific service needs and may be multi-modal serving other transit guideway treatments. These centers provide an interface between transit modes such as between buses offering different services. These facilities may co-exist with park-and-ride lots. Supporting stations and park-and-ride facilities are either located "on-line" in the median (I-110 as an example) or "off-line" with direct access ramps to facilities such as park-and-ride lots (Houston's system is an example). Figure 48 shows such supporting facilities.
Park and ride lots are large gathering sites for motorists to leave their car to take transit. These sites are also drop off and pick up points (often called kiss-and-ride). Park and ride lots need to be strategically located to take maximum advantage of upstream demand, and sized sufficiently to afford decent headways for buses. If point-to-point service is planned, then the lot needs to be big enough to account for full buses leaving at regular headways. If headways are further than 15 minutes apart, patronage will be adversely affected. This means that optimal sizing of park-and-ride lots needs to be from 100 to 300 spaces for linked service and 750 to 1,000 spaces for point-to-point service. An example lot and loading area are shown in Figure 49.
Figure 48: On-Line and Off-Line Transit Stations (I-110 Los Angeles left, I-45 Houston right) (right photo courtesy of Texas Transportation Institute)
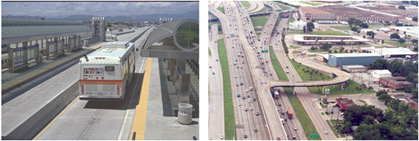
Figure 49: Park and Ride Lots (right photo courtesy of Texas Transportation Institute)
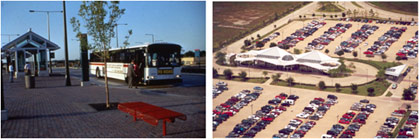
Park-and-pool lots are gathering places for less dense areas, serving both as gathering points for ridesharing and bus pooling primarily. Local transit service may also serve these sites. They are often near major cross-roads along a corridor (sometimes on excess public rights-of-way or on leased parking from other land uses), and much further out than express transit service facilities. Examples are shown in Figure 50.
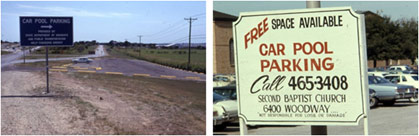
Standards on static signing and striping are covered in the 2009 MUTCD (Manual on Uniform Traffic Control Devices (MUTCD), Federal Highway Administration, Washington, D.C., 2009). The manual provides extensive guidance on how managed lanes should be signed and marked to effectively and consistently communicate various lane management strategies to motorists. Chapter 2G lays out standards and guidance related to the signing of managed lanes including signs to define vehicle occupancy, hours of operation, ingress and egress, and pricing. Lane markings for managed lanes are discussed in Chapter 3D. Some of the specific guidance related to dedicated managed lanes in the 2009 MUTCD includes:
Figure 51: Guide Sign for Entrance to Priced Managed Lane (MUTCD Section 2G.18, 2009)
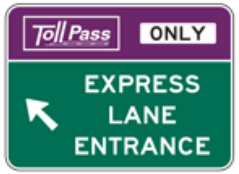
Information pertaining to active traffic management is less obvious in the MUTCD, but examples can be found in the following sections for the following applications:
In many of these applications it is possible to apply fixed signs with dynamic elements to communicate changing conditions. Some areas have adopted fully variable matrix signs to communicate this information to address flexible or changing needs in the future.
The ability of Intelligent Transportation Systems to facilitate freeway management strategies is documented in various chapters throughout this handbook. ITS technologies play a critical role in disseminating and gathering information necessary for the successful operation of managed lanes. The implementation of managed lane systems can often take advantage of existing ITS infrastructure on a freeway corridor by integrating or expanding on such systems. Some of the ITS components that are complementary to managed lanes include:
The ability of managed lane operators to respond to changing traffic conditions is vital to maintaining enhanced operating conditions. Traffic management centers (TMCs) serve as a hub for regional communication systems and are therefore ideal interfaces for managed lane operators.
This section discusses the various tasks and considerations associated with planning and successfully implementing a managed lane project.
In order for managed lane systems and facilities to be properly integrated within the freeway system, system-planning needs to occur at various levels, including strategic planning, long-range system planning, short-range planning, and service or operations planning. At the strategic planning level, highway, transit, and tolling agencies need to determine their roles, missions, and types of differential managed lane facilities and services they want to provide in a metropolitan area. Through the long-range planning process, agencies can ensure that managed lane facilities and services are incorporated into the future design of freeway systems and that funding for capital-intensive facilities are programmed into area transportation improvement plans.
Managed lane strategies which do not involve capacity expansion, tolling, and/or pricing are typically supported as part of an operating agency's normal activities, or are addressed during development of other components of the freeway management system (e.g., information dissemination subsystems). Consequently, the primary concern for these strategies is the extent to which introducing the new strategy affects the existing budget for operations and maintenance, and whether this impact can be accommodated through a reallocation of agency funds.
Managed lane options which involve the implementation of tolls and/or congestion pricing can result in revenues that are used to offset the cost of constructing, operating, and maintaining these facilities. Traditionally, toll facilities were converted to "free" roadways once the bonds used to construct the roadway had been paid. Current tolling authority for HOT lanes and congestion pricing applications allows agencies to continue toll operations after bond payment, and to use the revenues to fund other traffic management activities, often required within the corridor from which tolls are collected. As managed lane systems expand into regional networks, this corridor-specific revenue distribution may need to be revisited.
Successfully developing and operating managed lane facilities requires agencies that are responsible for the freeway and roadway system, transit services, rideshare programs, and toll collections to actively work together. Interagency cooperation and coordination is critical to the success of a managed lanes project. Whereas this cooperation is vital, experience also indicates that one agency or group needs to have overall responsibility, and that one individual or a small group of individuals (i.e., "champions") can be instrumental in the development, promotion, and support of managed lane projects.
Table 3 was excerpted from the NCHRP #414, HOV Systems Manual (NCHRP Report 414: HOV Systems Manual. TRB, National Research Council, Washington, D.C., 1998) and augmented with additional contemporary managed lane agencies. This table presents the example roles of each agency partner in developing, operating and enforcing a freeway-based managed lane facility.
Past experience from freeway management projects indicates a preference for implementing managed lane strategies and techniques incrementally where possible to develop operational experience, and to demonstrate the advantages of the techniques to elected officials and to the public. Often, managed lanes were developed under the auspices of small, demonstration-type projects at a location or over a section of freeway where the benefits were expected to be the greatest relative to the cost of implementation. In this way, the partners illustrated the benefits of the strategy and generated the support necessary to proceed with more extensive implementation if desired.
Contemporary planning for managed lanes emphasizes a new shift towards systems planning. Under the context of a managed lane system, individual corridors become a connected network, avoiding gaps which inhibit seamless travel for customers of all eligible users. The reasons for pursuing a managed lane network may include:
Agency/Group |
Potential Roles and Responsibilities |
|---|---|
State Department of Transportation |
|
Transit Agency |
|
State/Local Police |
|
Local Municipalities |
|
Rideshare Agency |
|
Toll Agency |
|
Metropolitan Planning Organization |
|
Federal Agencies |
|
Significant benefits can accrue from a connected managed lane system. A 2003 performance audit of the Los Angeles HOV system found that fully two-thirds of the travel benefits are lost at gaps in the system where HOV traffic is forced to merge into remaining travel lanes. From a financing and deliverability standpoint, completing a managed lane system can be achieved by considering a network as a whole. Pooling revenues significantly increases bonding capacity and makes it possible to finance development of some corridors that are unlikely to generate the level of revenue required to be financeable on their own. For any given area, whereas most corridors essentially break even (i.e., their revenues cover their operating and maintenance costs), just a few corridors generate net revenue on the order required to secure the bonds. Pooled together for the long term, though, even the "break-even" corridors produce significant net revenues.
While it is important to think of a managed lane network as a single system, geographic sub-areas and corridors can be designated for where sequencing and staging decisions have clear effects on other projects. These decisions provide the framework for a phasing strategy.
Managed lanes can be politically controversial, especially if they involve the consideration of pricing. Although the public may not initially perceive it, there are inherent differences between traditional toll roads and bridges, road pricing, express toll lanes, and managed lanes that will change the nature of opposition and promotion. Recognizing these differences has proven to be important for advancing any managed lanes project. Opportunities for outreach and coalition-building should be examined, as well as the activity levels of local citizen groups and institutions (example in Figure 52). Potential opinion-setting advocates and opponents, who will influence the opinion of travelers and commuters, can be divided into the following: policy makers, media, business groups, and interest and ideological groups.
Figure 52: Public Outreach for Managed Lanes, Denver, Colorado
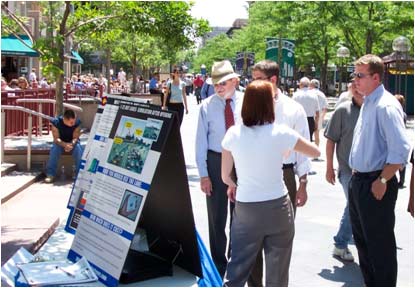
Marketing and promoting the managed lane facility is paramount to its successful implementation. More than one facility has either failed or had significant setbacks as a result of not informing or involving the public. The process of successful marketing of managed lanes includes:
Managed lanes primarily concern the ongoing and active management of freeway capacity to ensure free flow speeds and travel time reliability. As a result, the operational scheme must be designed to adapt and change to prevailing trends in traffic. Core to this adaptation is establishing a mechanism for regularly evaluating the effectiveness of the managed lane strategies. It is important to monitor the impacts and benefits of the strategies and techniques to determine if they meet the intended objectives and functions for which they were designed, and, if they continue to provide the benefits over time. Also, it is important that the evaluation data be collected so that they can be collated and disseminated in an ongoing manner to elected officials and the general public. In this way, continued funding for these strategies can be obtained more readily, and expansion of activities to further improve facility operations will be more readily accepted.
Evaluating the effectiveness of specific treatments should not be considered a one-time activity, but should be part of a periodic review of the effectiveness of the component and of the overall system. For each objective associated with managed lanes, (an) appropriate measure(s) of effectiveness should be identified, along with the desired threshold level of change that will be used to determine if the facility has met the objective.
Since 1999, the Federal Communications Commission (FCC) has reserved the 5.9 GHz frequency spectrum for the deployment of dedicated short range communications (DSRC). This relatively unused spectrum has been tapped by AASHTO and the USDOT for the integration of information between vehicles and roadway infrastructure. First known as the Vehicle Infrastructure Integration (VII) initiative and now promoted as a system that espouses features and capabilities for the next generation of ITS, current prototype systems do not necessarily require use of the 5.9 GHz spectrum, but could benefit significantly from it.
Two of the primary features for managed lane applications are:
Figure 53: Proposed Vehicle-to-Vehicle Communication (courtesy www.intellidriveusa.org, 2010)
Whereas AASHTO and USDOT have established trade-offs for managed lane facility design, future managed lane networks may rely upon an aggressive deployment of active traffic management (ATM) to complement the use of shoulder lanes for capacity expansion. Based upon established practice in Europe and described elsewhere in this chapter, ATM is useful as a safety and operational mitigation device in the use of shoulder lanes. Managed lane operations are able to benefit from selective application of available ATM strategies, notably connector and ramp metering, lane control signals, queue warning, and speed harmonization.
Ramp metering is already prevalent in many U.S. communities and provides benefits in smoothing critical merge activity and in delaying the onset of congestion. However, any sudden and unexpected formation of queues can contribute to unstable flow, loss of throughput and higher incidence of crashes. The implementation of speed harmonization and queue warning to compliment ramp and connector metering would help resolve the unstable traffic parameters leading from entrance ramp to managed lane, especially with use of shoulders.
Altogether, the use of speed harmonization, queue warning, connector and ramp metering, and lane control signalization constitutes a managed corridor, whereby traffic patterns are affected across all lanes of travel. This managed corridor, though, may still benefit from managed lanes within the corridor. Much like a similar application implemented along the I-35W PDSL project, these managed corridor treatments increase efficiency and improve operational safety. As applied on I-35W, the inside shoulder is expanded to 14 feet, with use allowed for eligible traffic during peak periods, reverting to breakdown/refuge only in off-peak periods. ATM is used to manage flows, and provide warnings of downstream incidents. Additionally, emergency refuge areas are constructed every ¼ mile whenever an interchange is not available downstream. This design section not only assists in implementing a managed lane, but it also serves as a mitigating tool for safety concerns.
Public Private Partnerships (P3) have started to become an important tool for the implementation of managed lane systems. P3 is most useful for priced managed lane applications, where revenue is generated by the project; however, P3 applications may also be appropriate where project acceleration is desired. As an alternative project delivery mechanism, P3 can take many forms, with escalating levels of leverage and risk in exchange for financing. Private sector participation may be involved in a traditional, fully-segmented procurement approach (design – bid – build) to a fully integrated method requiring a true partnership with the private sector, such as design – build – operate – maintain models. Projects with sufficient revenue to support financing for all or a meaningful portion of the managed lane project development and implementation costs are usually good candidates for long-term private financing when the public entity's goal is to maximize funding capacity. P3 delivery entails a transfer of risk to the private sector partner. For priced managed lanes, this risk transference is typically associated with revenue. The risks associated with revenue collection can be assumed either by the private sector or by the public sector through revenue guarantees or shadow tolling.
Two recent examples illustrate the use of P3 for managed lane development.
The Exclusive Bus Lane (XBL) on New Jersey Route 495 is one of the few examples of a managed lane on a freeway facility dedicated to the exclusive use of buses. The XBL was the nation's first contra-flow bus-only lane on a freeway and paved the way for future implementation of Bus Rapid Transit (BRT) systems around the country. Today the XBL still carries the largest volume of buses and passengers of any HOV lane in North America.
The Port Authority of New York and New Jersey opened the Exclusive Bus Lane on New Jersey Route 495 on December 18, 1970. This contra-flow bus lane operates within a 10-foot lane on a 2.5-mile segment of Route 495 leading from the New Jersey Turnpike to the Lincoln Tunnel and provides a vital link to the Midtown Port Authority Bus Terminal in midtown Manhattan. Each weekday morning from 6-10 a.m., one westbound travel lane is converted to serve buses heading eastbound through the tunnel (Figure 54). The XBL serves over 1,700 buses and carries more than 62,000 passengers to midtown Manhattan every weekday morning, which represents almost 80 percent of the tunnel's peak period inbound person-trips (The Port Authority of New York and New Jersey (PANYNJ). Annual Report 2006. Accessed June 26, 2010). Directionality is communicated through the daily placement of plastic pylons that delineate the contraflow lane and use of overhead lane controls.
Figure 54: XBL being Deployed (left) and Operational (right)
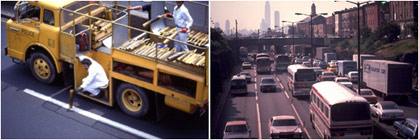
Even before the XBL was implemented, bus volumes through the Lincoln Tunnel were high due to the large number of routes serving commute trips from New Jersey into downtown Manhattan. Figure 55 shows the level of demand in 2008 for eastbound trips over the Hudson River, for which the Lincoln Tunnel serves as one of only three crossing points. Bus volumes have increased dramatically since the inception of the XBL, although the level of growth is slowing due to capacity constraints. When first opened, there were some 800 buses during the four hour AM peak period. That volume grew to 1,600 buses in 1986 and then more slowly to 1,700 buses in 1999 (TCRP Report 95: Traveler Response to Transportation System Changes, Chapter 14: Road Value Pricing. TRB, National Research Council, Washington, D.C., 2003). Since 1999, bus volumes have remained fairly constant indicating that the facility has approached its capacity.
Figure 55: 2008 Average Weekday Bus and Car Trips on the George Washington Bridge, Lincoln and Holland Tunnels (Source: Port Authority of New York and New Jersey)
The reputation of the XBL as an express route to bypass congestion is being threatened as the XBL approaches capacity. The XBL is still reported to save bus riders an average of 15 to 20 minutes as compared to travel in the general purpose lanes, but the ability of the XBL to continue to provide meaningful travel time savings as the lane approaches capacity is in jeopardy. The Port Authority projects bus trips across the Hudson River to increase by 18 percent by 2030. In response to growing demand on the XBL, the Port Authority commissioned a study in 2006 that identified four alternatives for helping to alleviate congestion in the Lincoln Tunnel. One option identified was to create a second bus lane by taking one of the eastbound general purpose lanes and operating it as a concurrent bus lane (see Figure 56).
Figure 56: Possible Option to Convert Eastbound General Purpose Lane to HOV (Source: Port Authority of New York and New Jersey)
The dedication of a second bus priority lane would likely leave a significant amount of excess capacity in the bus lane and simultaneously cause increased congestion in the general purpose lanes. As a result, the Port Authority is investigating the application of a HOT strategy for a second bus lane (VPP Projects Involving Tolls Category: Priced Lanes, Sub-Category: Priced Tollways, FHWA. Accessed June 26, 2010) [Link no longer active]. This strategy would allow other vehicles to pay to use any excess capacity in the converted general purpose lane. The implementation of a HOT lane in this setting poses several challenges due to the high number of buses, restricted lane and shoulder widths, and prediction that bus traffic is expected to increase significantly in the future.
The conversion of HOV lanes to HOT operation is becoming increasingly popular, and the I-394 and I-35W MnPass Lanes are two such examples. The MnPass lanes allow single occupant vehicles to pay an electronic toll to use the HOV lanes while transit buses, carpools (HOV-2+) and motorcycles continue to use the lanes for free. When pricing was implemented in May 2005, I-394 was the first project to toll on a facility that is separated from adjacent general purpose lanes by only a painted buffer along much of its distance. The I-35W MnPass lanes opened in 2009 are the first example nationally to incorporate the use of a priced dynamic shoulder lane during peak periods.
I-394 extends 11 miles and connects downtown Minneapolis and I-94 in the east with I-494 and various suburbs in the west. The MnPass facility on this corridor consists of a three- mile section of two barrier-separated reversible lanes and eight miles of buffer-separated diamond lanes (see Figure 57). The reversible section is always tolled when it is operational, while the buffer-separated lanes only operate during morning and evening peak periods (6am-10am and 2pm-7pm) and are open to all traffic otherwise.
Figure 57: I-394 MnPass Lanes (courtesy Minnesota DOT)
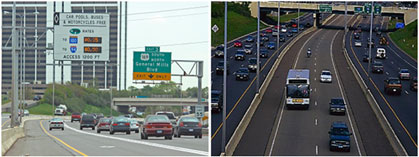
I-394 was opened with HOV lanes in 1992, but underutilization and increasing congestion in the general purpose lanes resulted in frequent requests to open the HOV lanes to use by all traffic. In response, the Minnesota Department of Transportation (MnDOT) commissioned a study to evaluate the effectiveness of the lanes. The study was completed in 2001 and found that opening the HOV lanes to all traffic would result in a congested facility and that conversion to HOT operations would be the most cost-effective solution (Cambridge Systematics. Twin Cities HOV Study: Volume I [Link no longer active]. Accessed June 26, 2010). A Value Pricing Task Force representing a broad constituency of transportation interests also recommended that the HOV facility on I-394 be converted to HOT lanes. In 2003 the necessary legislation was passed in Minnesota to allow MnDOT to proceed with implementation.
The MnPass lanes on I-35W were implemented more recently in September of 2009 and are currently split into two unconnected segments. The southern portion converted a 5.7 mile NB and a 7.5 mile SB buffer-separated HOV lane into a HOT lane. Like the non-reversible section of the I-394 lanes, these lanes are only tolled during peak periods. Closer to downtown Minneapolis, there is also a 1.2 mile segment called a priced dynamic shoulder lane (PDSL). The PDSL allows eligible and toll-paying vehicles to use the inside shoulder during the morning peak period only. Overhead signs and lane control signals tell motorists whether the PDSL is open to traffic (see Figure 58).
Figure 58: Overhead Lane Controls on PDSL, Minneapolis, Minnesota (courtesy Minnesota DOT)
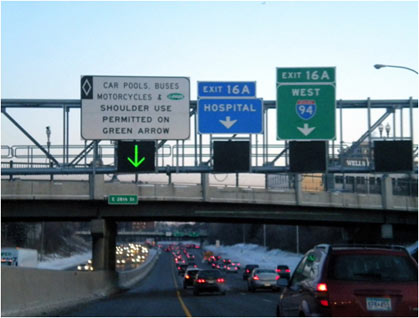
Tolls for SOVs are calculated according to the level of traffic on the express lanes. The toll level is adjusted as frequently as every three minutes to manage demand and ensure that speeds on the lanes remain at 50-55 miles per hour. Current toll rates average between $1.00 and $4.00, with the maximum toll set at $8.00 (Minnesota Department of Transportation MnPASS website. Accessed June 26, 2010). Electronic signs along the I-394 and I-35W corridors display the current toll to use the lanes and also tell motorists whether the lanes are in operation. These signs read "OPEN" when the lanes are open to general traffic and show a price when tolling is in effect. The one exception is the PDSL reverts to a breakdown shoulder when it is not being used as a HOT lane. All tolls are collected using electronic toll collection. SOVs who choose to use the lanes must open a MnPass account and obtain and mount a transponder in their vehicles. These transponders communicate with readers mounted on overhead gantries and debit the user's prepaid account each time they use the lanes.
Support for the MnPass projects did not encounter as much public opposition as previous attempts to implement value pricing in Minnesota. Researchers have attributed this to a general change in attitude among the public at large regarding such policies. This shift was driven in large part by the large state budget deficit, growing congestion, and a new awareness among the public regarding transportation issues and value pricing specifically. A 2004 survey, just prior to the development of the facility, found that 6 out of 10 residents within the I-394 corridor supported the idea of giving solo drivers the option paying a toll to use the I-394 HOV lanes (Zmud, J., M. Bradley, and C. Simek, Attitudes and Willingness to Pay for Tolled Facilities. In Transportation Research Record, No. 1812, Transportation Research Board, Washington, D.C., 2007, pp. 58-65).
As the primary east-west highway corridor connecting Washington, D.C. and Northern Virginia, I-66 suffers from heavy commute traffic. Different HOV strategies have been implemented on segments of I-66 to help alleviate congestion during peak periods. As an example, all lanes on the segment of I-66 between the Capital Beltway and the Theodore Roosevelt Bridge are restricted to HOV-2+ vehicles and Dulles Airport traffic during morning and afternoon peak periods.
The 6.5 mile segment of I-66 from the Beltway to U.S. 50 is less restrictive and only reserves the leftmost lane to HOV-2+ use. What makes this segment unique is the fact that while HOV-2+ restrictions are in effect, the right shoulder is converted to use by general purpose vehicles to maintain 3 general purpose lanes in each direction at all times. This dynamic HOV/Shoulder Lane (HOV/SL) on I-66 allows for continuous access to the HOV lane along 15 miles of the corridor west of U.S. 50, and at the same time the operation maintains the same number of three general purpose lanes in each direction without the need for costly expansion (see Figure 59).
Figure 59: Dynamic HOV Lane (leftmost lane) and Dynamic Shoulder Lane (rightmost lane) on I-66
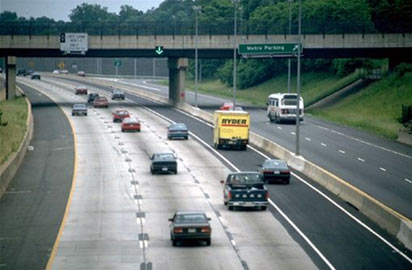
The HOV/SL operates during morning and afternoon peak periods. The left lane operates as an HOV lane from 5:30 am – 9:30 am in the eastbound direction and from 3:00 pm – 7:00 pm in the westbound direction. However, the right shoulder lane is open for longer periods of time since congestion often extends beyond the HOV hours of operation. The shoulder lane remains open to all traffic until 11 am in the eastbound direction and is open for a period starting one hour earlier and ending one hour later than the HOV hours in the westbound direction. Overhead signage and lane control signals inform motorists when the shoulder lane is open to traffic (see Figure 60). A red X over the lane indicates that the shoulder is closed to traffic and a green arrow indicates that the shoulder is available for use as a travel lane.
Figure 60: I-66 Shoulder Lane Control Sign and Signal
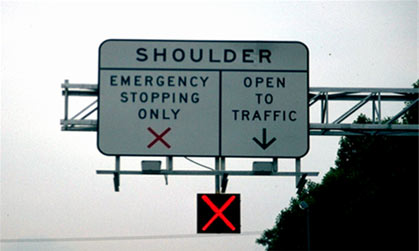
There are a total of nine emergency refuge areas located along the HOV/SL segment (4 eastbound and 5 westbound) that provide accommodation for breakdowns and enforcement activities. Each of the three general purpose travel lanes, including the lane converted to HOV use during peak periods, are 12 feet wide. The exterior shoulder that is opened to traffic while HOV operations are in effect is 11 feet wide. Despite the reduced lane width and the movement of vehicles into and out of the shoulder, a study of crash data collected between 2002 and 2004 concluded that the HOV/SL managed lane strategy did not contribute significantly to an increase in crash frequency (Lee, J.T.; Dittberner, R.; and Sripathi, Hari. Safety Impacts of Freeway Managed-Lane Strategy: Inside Lane for High Occupancy Vehicle use and Right Shoulder Lane as Travel Lane During Peak Periods, Transportation Research Record, Transportation Research Board, Washington, DC, 2008).
In 2007, typical traffic volumes during the eastbound HOV/SL hours ranged from 19,500 to 27,000 vehicles; with 21,000 to 25,000 vehicles westbound. These compare with 184,000 AADT for the corridor in this segment (Virginia Department of Transportation. 2007 Traffic Data. Accessed June 26, 2010). Within the HOV/SL segment, volume- to-capacity (V/C) ratios ranged between 0.90 and 1.00 in the eastbound direction. In the westbound direction LOS F conditions were common, with V/C ratios between 0.83 and 1.01.
Increasing congestion along the corridor prompted a Major Investment Study for the portion of I-66 outside of the Capital Beltway in 1999. The study recommended the construction of barrier-separated, reversible HOV lanes and the addition of one general purpose lane in each direction (Virginia Department of Transportation. I-66 Multimodal Transportation and Environmental Study, 2003. Accessed June 26, 2010. Note: Removed from intranet after access date.). More recently, Virginia DOT commissioned an I-66 Multimodal Transportation and Environmental Study to evaluate improvements that can accommodate future traffic demands. This study is still ongoing.
A study of crash data collected between 2002 and 2004 concluded that the HOV/SL managed lane strategy did not contribute significantly to an increase in crash frequency (Lee, J.T.; Dittberner, R.; and Sripathi, Hari. Safety Impacts of Freeway Managed-Lane Strategy: Inside Lane for High Occupancy Vehicle use and Right Shoulder Lane as Travel Lane During Peak Periods, Transportation Research Record, Transportation Research Board, Washington, DC, 2008). Researchers found that high AADT volumes, light conditions, and aggressive behavior by motorists were bigger influencers of crashes than HOV/SL operations.
The Active Traffic Management (ATM) system in use on Great Britain's M42 motorway is an example of a strategy intended to manage traffic on an entire corridor. The ATM system in use on this section of motorway illustrates how various traffic management strategies can be combined to better manage traffic on a congested corridor. The highlight of the system is the ability to automatically alert drivers to reduce speeds and to allocate temporary use of the shoulder lane during periods of congestion.
The M42 motorway serves as part of a north-east to south-west cross-country route in Great Britain. Between Junction 3a and Junction 7, the 11 mile segment of the motorway forms part of a circumferential route around the city of Birmingham. This six-lane section of motorway serves as an access road to Birmingham Airport as well as several business parks and residential areas, and as a result experiences variable traffic volumes that often lead to vehicle slow-downs. In 2001, the Minister of Transport commissioned the M42 Active Traffic Management Pilot Program with the goal of cutting congestion and increasing capacity using various ATM strategies. Different elements of the ATM system have come online in phases since construction began in 2003. The completed system includes installation of the following:
The elements listed above are used synchronously to avoid breakdowns in the traffic flow during congested peak periods. When roadway sensors detect that vehicle speeds at a particular location are dropping below a predefined threshold, variable speed limits and dynamic message signs are automatically engaged at upstream locations to alert motorists to the presence of congestion ahead. This process is executed based on an assessment algorithm and does not require any intervention by an operator. Variable speed limits are shown on lane control signals affixed to overhead gantries spaced at regular intervals throughout the corridor (Figure 61). Speeds adjust downward on successive upstream gantries typically in 10 mph increments, and are seldom set below about 40mph even if stop-and-go conditions are present around the incident site. For a typical incident involving a stalled vehicle, the closest gantry might show 40mph, graduating back through the traffic stream showing 50mph and 60mph, respectively, up to the given speed limit.
Figure 61: Variable Speed Limit and Dynamic Message Sign, M42 Motorway, Manchester, United Kingdom (courtesy Highways Agency, UK)
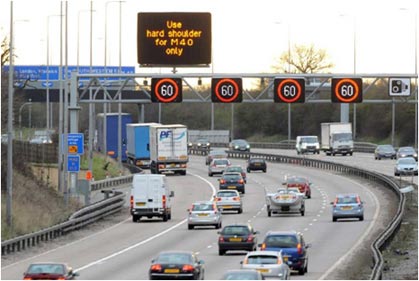
The M42 ATM system also utilizes the outside shoulder as a travel lane during periods of congestion. As shown in Figure 61, dynamic message signs are used to inform motorists about the use of the shoulder as a travel lane. The dynamic shoulder is engaged to relieve congestion and manage incidents. Initially, the shoulder lane was only activated when speeds dropped to 50 mph, but starting in 2008 the shoulder has been used with posted speeds of up to 60 mph (UK Highways Agency. M42 ATM Monitoring and Evaluation 4-Lane Variable Mandatory Speed Limits: HSR60 6 Month Operation Report, 2009. [Link is no longer active]). To compensate for the loss of the shoulder as a refuge area during peak periods, the project has added emergency refuge areas spaced at about 1,600 foot intervals (see Figure 62). Emergency call boxes are also provided at each refuge area.
The UK Highways Agency has also commissioned a M42 Active Traffic Management monitoring and evaluation project to evaluate the performance of the pilot project. A report released in June 2008 concluded that the M42 ATM system was successful in reducing congestion, improving travel time reliability, and increasing capacity (UK Highways Agency. M42 ATM Monitoring and Evaluation Project Summary Report, 2009.). The report documents a 9 percent increase in observed capacity, a 9 to24 percent reduction in travel times, and a 22 percent reduction in the variability of travel times. Furthermore, vehicle emissions have been reduced between 4-10 percent and fuel consumption has been reduced by 4 percent.
Figure 62: M42 Motorway Showing Emergency Pullout, Manchester, United Kingdom.
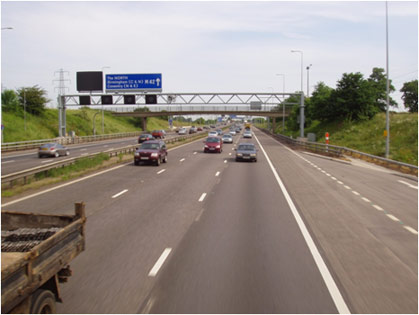
You will need the Adobe Reader to view the PDFs on this page.
|
United States Department of Transportation - Federal Highway Administration |
||