
Freeway Management and Operations Handbook
Chapter 15 – Detection
and Surveillance
Page 1 of 3
15.1 Introduction
In a traffic management system, the detection and surveillance component supports the process in which data are collected to describe or characterize traffic flow conditions on the highway. The data are used to supply information about conditions on the roadway to other system components. Thus, detection and surveillance provide the information needed to perform the following traffic management functions:
- Measuring traffic flow and environmental conditions.
- Formulating control decisions.
- Disseminating traveler information.
- Monitoring and evaluating system performance.
- Supporting other freeway management and operations functions such as incident detection and verification, planned special event and emergency management, ramp management, and transportation planning.
The requirements for these functions, in terms of the types and accuracies of data and information, and the spatial and temporal resolution of the data needed, depend on the specific application and the manner in which the application is implemented. For example, traveler information may require average speed / travel time information collected at selected intervals along the roadway and available in real time. On the other hand, transportation planning needs – particularly inputs for network analysis models – may require additional information (e.g., volumes, vehicle classifications) at different spacings, and the ability to warehouse the information for subsequent analyses.
Detection and surveillance are not limited to collecting and monitoring traffic condition information alone, nor in some instances are they automated in nature. Detection and surveillance are utilized to gather weather and pavement data, which provide operators and maintenance staff additional information to support their traffic management responsibilities.
Road and weather information systems also are being used to manage snow removal, icy roadway treatment, detect limited sight distance problems caused by fog or smoke, and detect high water levels along roadways. While a great deal of traffic detection data are gathered via automated means, manual detection, most notably via cellular telephone calls from motorists, is also a viable and reliable data acquisition strategy.
15.1.1 Purpose of Chapter
This chapter is a resource for practitioners involved with all aspects of freeway management who utilize freeway condition and traffic flow information in the performance of their duties. It provides an overview of surveillance and detection sensor technology options to assist in planning, implementation, and maintenance of these systems. The topics include discussions of:
- Elements of detection and surveillance systems,
- Their role in freeway management,
- Issues involved in planning and commissioning these systems and technologies,
- Emerging trends,
- Examples
With respect to sensor technologies, the Traffic Detector Handbook (Reference 1) is the most complete and up-to-date reference available from FHWA. Another useful source of information concerning sensor technologies and their applications to ITS is Reference 2. Accordingly, traffic detection discussions in this chapter are addressed at a high-level summary. Other surveillance options (i.e., not addressed in Reference 1) are also described, including probe-based surveillance, video surveillance (i.e., the use of real time video images of the freeway), and road-weather information systems (RWIS). Recent evaluations of sensors and technologies to vehicle detection and traffic flow measurement are found in References 4 through 10.
15.1.2 Relationship to Other Freeway Management Activities
Practically every freeway management activity is related to or dependent upon detection and surveillance in some manner, and to understand the role of detection and surveillance within the freeway management spectrum, it is important to understand the relationships with these activities. The following table 15-1 lists those related activities and their relationship to the other chapters of this Handbook.
| Activity | Relationship |
|---|---|
| Performance Monitoring (Chapter 4) | The development and evaluation of performance measures is dependent on the collection and warehousing of data regarding freeway traffic flow. Additionally, this information is used to calibrate simulation models. |
Ramp Management and Control (Chapter 7) Lane Management and Control (Chapter 8) |
Both ramp and lane management rely on real time traffic data. Traffic data necessary includes volume, speed and occupancy data for algorithm calculations. Further, video surveillance is important for ramp and lane management to allow an operator to verify conditions prior to making lane configuration changes or opening a ramp for a reversible lane. |
Traffic Incident Management (Chapter 10) Planned Special Event Management and Control (Chapter 11) Emergency & Evacuation Management (Chapter 12) |
Critical to the success of these management strategies is monitoring real-time traffic conditions to determine an anomaly in traffic flow, which signify to an operator the possibility of an incident. Video surveillance, too, is a key element to verifying and diagnosing an incident. Weather-related conditions that create incidents, such as fog or icy pavement conditions, are detected using Remote Weather Information Systems. |
| Information Dissemination (Chapter 13) | In many cases, the detection and surveillance subsystems provide the real-time data necessary to develop the information to disseminate to travelers. For instance speed or vehicle location data collected from the detection subsystem is translated to congestion indices or travel time measurements to inform travelers of conditions on the roadway. Video from surveillance systems is commonly placed on web sites to allow pre-trip travelers to survey conditions on the roadway. |
| Traffic Management Centers (Chapter 14) | In many cases, it is the Traffic Management Center where detection and surveillance data is bought for processing and management. Traffic Management Centers house the central systems that control and manage the detection and surveillance systems. |
| Regional Integration (Chapter 16) | Information from the detection and surveillance subsystem is shared
across jurisdictional boundaries and information conveyed to the traveler
can be "regional" in nature, i.e., the effected area may not be in
the local control area of the system, but may still effect local travelers. |
15.2 Current Practices, Methods, Strategies, and Technologies
15.2.1 Overview
Information is crucial for successful operations of the transportation network. As noted in a FHWA TEA-21 reauthorization proposal (3):
"Operating the highway system to achieve security, safety, and reliability objectives requires an ability to know what is happening on the system. Real-time information on highway system performance and weather conditions / events is vital to assist highway professionals in managing the available capacity, responding to disruptions to capacity (including emergencies, evacuations, and security threats), and to system users in planning the timing, mode, and route for their trips".
In essence, the many benefits of the various freeway management strategies – as discussed in other chapters herein – cannot be fully realized unless practitioners are aware of the real time conditions on the freeway network. The required information varies widely depending on the service being provided, how often data needs to be collected, and how accurate it needs to be. For example, traveler information and traffic management services require information of different types and accuracies concerning pavement conditions. A traveler may only need to know whether the pavement is wet or icy, whereas a traffic management and operations department concerned with snow and ice control requires additional and more detailed and accurate information.
Many different technologies are utilized for collecting detection and surveillance information, including in-roadway and over-roadway sensors for measuring traffic flow parameters, vehicle probes for collecting data on travel times and origin-destination information, closed circuit television (CCTV) systems for viewing real time video images of the freeway, road weather information systems (RWIS) for monitoring pavement and weather conditions, and manual methods such as gathering information from drivers via their cellular telephones.
15.2.2 Benefits
Detection and surveillance, whether highly technical and automated, or simple and manual, are the cornerstone of any freeway management program. Freeway management strategies and ITS technologies can assist in reducing congestion, improving safety, and enhancing mobility. However, without the capability to know the current freeway operating conditions, coupled with the cooperation and coordination among personnel in the responsible agencies, the potential benefits of these strategies and technology systems may not be realized. To that end, it is not a simple matter to quantify benefits from detection and surveillance alone, but instead to understand the benefits realized from freeway management strategies and ITS technologies that rely on detection and surveillance. Some benefits of particular importance include:
- Reduction in delay and congestion related to early detection and diagnosis of incidents.
- Reduced secondary accidents as a result of early incident detection.
- Reduction in road maintenance costs (i.e., labor, materials and equipment) associated with the use of Road Weather Information System (RWIS) technologies and winter road treatment strategies (e.g., anti-icing, snow plowing)
- Improved traveler information
In summary, most of the benefits realized by ITS applications are the result, in some way, from the real-time information provided by the detection and surveillance subsystems.
15.2.3 Key Considerations During Freeway Management Program Development
Given that detection and surveillance are integral parts of a Freeway Management System (FMS) and the overall freeway management program, it follows that detection and surveillance must be duly considered throughout whatever process is used to develop and deploy the FMS / freeway management program. Of particular importance (referring back to the "funnel diagram" in Chapter 3) are the following:
- Coordinate with regional / statewide transportation planning: The surveillance subsystem should be designed to provide the traffic information necessary to support the decision-making processes and to develop the various transportation plans mandated by Federal law.
- Stakeholders: Many of the freeway management stakeholders will have specific information requirements. Their needs in this regard should be reflected in the development of the surveillance subsystems.
- Concept of Operations lays out the program concept, explains how things are expected to work once it's in operation, and identifies the responsibilities of the various stakeholders for making this happen. Information needs – without describing actual surveillance technologies – must be an integral part of the Con Ops.
- Determine Performance Measures: The performance measures provide the basis for evaluating the transportation system operating conditions and identifying the location and severity of congestion and other problems. The surveillance subsystem can provide the mechanism for collecting the data necessary for quantifying the operation of the network.
- Operations and maintenance: If the surveillance subsystem is not adequately implemented and maintained, a serious constraint on the overall operation of the freeway can result.
15.2.4 Relationship to National ITS Architectures
As indicated in Chapter 3, the National ITS Architecture provides a common structure or framework to promote compatibility and interoperability among systems, products, and services. The architecture defines the functions that must be performed to implement a given service, the physical entities or subsystems where these functions reside (e.g., the roadside or the vehicle), the interfaces / information flows among the physical subsystems, and the communication requirements for the information flows.
The National ITS Architecture can serve as the basic building block of the functional requirements definition process for detection and surveillance. The functions described in the National Architecture must then be detailed to match the needs and desires of the local agencies. The National ITS Architecture defines various ITS elements and strategies in terms of market packages. This concept recognizes that various ITS components must work together to achieve system goals. They are "tailored to fit separately or in combination-real world transportation problems." Market packages relevant to detection and surveillance include:
- Network Surveillance Market Package. This market package includes the roadside sensors with appropriate control and communication infrastructure to interface with other market packages such as traffic management and traveler information.
- Probe Surveillance Market Package. This market package is an alternative to traditional network surveillance elements and does not require the extensive distributed roadside infrastructure but does require wireless communication between probe vehicles and other market packages such as freeway control and surface street control.
- Emissions and Environmental Hazards Market Package. This market package provides emissions and hazards information.
- Incident Management Market Package. This market package includes incident detection capabilities through roadside surveillance devices (e.g., CCTV).
- Road Weather Data Collection. This market package collects current road and weather conditions using data collected from environmental sensors deployed on and about the roadway.
- Weather Information Processing and Distribution. This market package processes and distributes the environmental information collected from the Road Weather Data Collection market package. This market package uses the environmental data to detect environmental hazards such as icy road conditions, high winds, dense fog, etc. so system operators and decision support systems can make decision on corrective actions to take.
15.2.5 Types of Data
The measurements that have traditionally been used to monitor traffic operations on freeways include the following:
- Volume – Used to measure the quantity of traffic. Volume is defined as the number of vehicles observed or predicted to pass over a given point or section of a lane or roadway during a given time. Volume is typically used to track historical trends and to predict the future occurrence of congestion on specified freeway sections.
- Speed – An important measurement in determining the quality of traffic operations. Speed is frequently used to describe traffic operations because it is easy to explain and understand. Speed measurements are typically taken for individual vehicles and averaged to characterize the traffic stream as a whole. Measured speeds can be compared to optimum values to estimate the level of operations for a freeway or to detect incidents. For example, an alarm for an incident detection system might be triggered if average speeds fall below a target value.
- Occupancy – Defined as the percent of time a given section of roadway is occupied by a vehicle and can be used as a surrogate for density. Occupancy is measured using presence detectors and is easier to measure than density. Occupancy is measured on a lane-by-lane basis, with values ranging from 0 percent (no vehicles passing over a section of roadway) to 100 percent (vehicles stopped over a section of roadway).
Although volume, speed, and occupancy have been the traditional types of data collected by a surveillance system, today's traffic management centers also rely on other types of data for traffic management purposes. Examples of other data include the following:
- Vehicle travel times.
- Vehicle location.
- Bus location.
- Emergency vehicle location.
- Queue length.
- Pavement condition (e.g., dry, wet, icy, freeze-point temperature, chemical concentration).
- Atmospheric condition (e.g., temperature, humidity, rain, snow, fog).
Both real-time and historical data may be used for traffic management purposes. Real-time data is needed in a freeway management system for monitoring current traffic operating and environmental conditions, detecting incidents, and implementing control strategies. Historical data refers to past traffic conditions on a given section of freeway. Historical data can be used for several purposes, such as establishing a record of past traffic conditions on a certain freeway section; comparing real-time data to historical data to determine irregular traffic patterns; monitoring performance, such as before/after analyses to determine the effects of implementing certain traffic management techniques; and calibrating simulation models for analyzing potential improvements and establishing priorities for deployment.
15.2.6 Traffic Flow Sensors
A traffic flow sensor is a device that indicates the presence or passage of vehicles and provides data or information that supports traffic management applications such as freeway mainline and ramp control, incident detection, and gathering of vehicle volume and classification data to meet state and federal reporting requirements. (1)
While inductive loop detectors have been used extensively on freeways, other sensors such as magnetometers, video image processors, microwave radars, passive and active infrared sensors, and acoustic sensors are finding their way into freeway traffic management applications that require vehicle detection. These sensors can provide data not available from inductive loop detectors and enhanced safety for the personnel that install and maintain them. Vehicles themselves can become "probes" for obtaining information on travel times. Additional surveillance requirements may require other technologies, including video, road surface and weather information, and infrastructure security.
The Traffic Detector Handbook (1) and Reference 2 describe the theory of operation, installation, and applications of the various sensor technologies in depth. Sensor types are divided into in-roadway and over-roadway classes, defined as follows:
- An in-roadway sensor is one that is embedded in the pavement of the roadway, embedded in the subgrade of the roadway, or taped or otherwise attached to the surface of the roadway. Examples of in-roadway sensors include inductive loop detectors, which are sawcut into the pavement; and magnetometers, which may be placed underneath a paved roadway or bridge structure.
- By contrast, an over-roadway sensor, or non-intrusive sensor, is one that is mounted above the surface of the roadway either above the roadway itself or alongside the roadway, offset from the nearest traffic lane by some distance. Examples of over-roadway sensors are video image processors that utilize cameras mounted on tall poles adjacent to the roadway or traffic signal mast arms over the roadway; microwave radar, ultrasonic, and passive infrared sensors mounted in a similar manner; and laser radar sensors mounted on structures that span the lanes to be monitored.
The following sections present brief overviews of the current technologies available for surveillance and technology. These are taken from the Traffic Detector Handbook and References 2 and 3. Following the section on sensors, Tables 15-2 and 15-3, from the Traffic Detector Handbook and Reference 2, summarize the strengths and weaknesses of commercially-available sensors and itemize the traffic output data (typical), communications bandwidth, and cost of commercially available sensors, respectively.
15.2.6.1 Inductive Loop Sensors
An inductive loop detector senses the presence of a conductive metal object by inducing currents in the object, which reduce the loop inductance. Inductive loop detectors are installed in the roadway surface. They consist of four parts: a wire loop of one or more turns of wire embedded in the roadway pavement, a lead-in wire running from the wire loop to a pull box, a lead-in cable connecting the lead-in wire at the pull box to the controller, and an electronics unit housed in the controller cabinet as shown in Figure 15-1. The electronics unit contains an oscillator and amplifiers that excite the embedded wire loop. The electronics unit also supports other functions such as selection of loop sensitivity and pulse or presence mode operation.
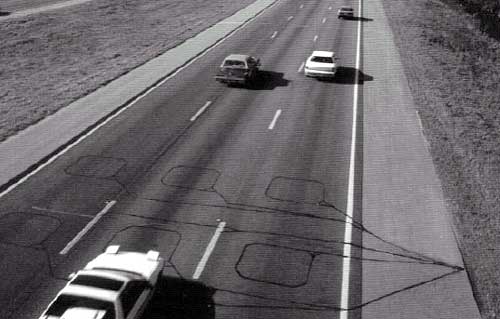
Figure 15-1: Inductive Loop Detector System (Reference 1, 2)
When a vehicle passes over the wire loop or is stopped within the area enclosed by the loop, it reduces the loop inductance, which unbalances the tuned circuit of which the loop is a part. The resulting increase in oscillator frequency is detected by the electronics unit and interpreted as a detected vehicle by the controller.
Conventional inductive loops are constructed by cutting a slot in the pavement and placing one or more turns of wire in the slot as indicated in Figure 15-2. The wire is then covered with sealant. The size, shape, and configuration of the loop vary depending upon the specific application, ranging from the common 6- x 6-ft (1.8- x 1.8-m) loops (Note: Some agencies use circular 6-foot loops), to long rectangular loops 6- x 40- to 70-ft (1.8- x 12- to 21-m) for actuated signal control. Because of the flexibility of its design, the inductive loop detector is capable of detecting a broad range of vehicles.
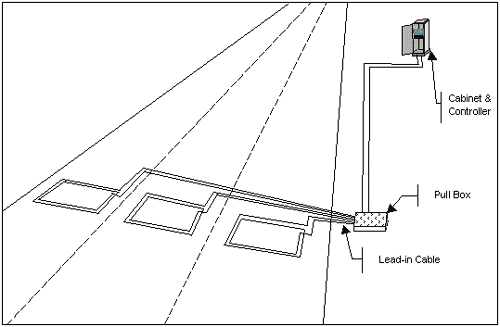
Figure 15-2: Inductive Loop Configuration Example
15.2.6.2 Magnetic Sensors
Magnetic sensors are passive devices that detect the presence of a ferrous metal object through the perturbation (known as a magnetic anomaly) they cause in the Earth's magnetic field. Two types of magnetic field sensors are used for traffic flow parameter measurement. The first type, the two-axis fluxgate magnetometer, detects changes in the vertical and horizontal components of the Earth's magnetic field produced by a ferrous metal vehicle. It detects stationary and moving vehicles. Fluxgate magnetometers are cylindrical in shape and are inserted into holes drilled into the roadbed from the top of road surface.
The second type is the magnetic detector, more properly referred to as an induction or search coil magnetometer. It detects a moving ferrous metal vehicle by measuring the distortion in the magnetic flux lines induced by the change in the Earth's magnetic field produced the vehicle. Magnetic detectors are inserted horizontally below the roadway. Since they provide only passage data and not occupancy or presence data, their use is limited to special applications. Another device similar to the magnetic detector is the microloop probe. As a vehicle passes over the microloop, the change in inductance is sensed by a conventional inductive loop detector electronics unit.
15.2.6.3 Microwave Radar
Figure 15-3 illustrates the operation of microwave radar sensors. A portion of the transmitted energy is scattered by the vehicle back toward the sensor, where it is detected and converted into vehicle and traffic flow information by the sensor alone or in conjunction with a roadside controller.
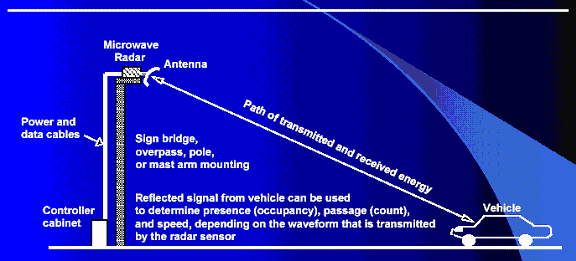
Figure 15-3: Microwave Radar Operation (Reference 1, 2) D
Two types of microwave radar sensors are used in roadside applications, those that transmit continuous wave (CW) Doppler waveforms and those that transmit frequency modulated continuous waves (FMCW). The Doppler sensor is also referred to in some literature as a microwave or microwave Doppler sensor. The constant frequency signal (with respect to time) allows vehicle speed to be measured using the Doppler principle. Accordingly, the frequency of the received signal is decreased by a vehicle moving away from the radar and increased by a vehicle moving toward the radar. Vehicle passage or count is denoted by a frequency shift in the received signal. Vehicle presence cannot be measured with the constant frequency waveform as only moving vehicles are detected.
The FMCW microwave radar sensor varies the transmitted frequency with respect to time in a prescribed manner. These sensors detect vehicle presence and vehicle passage. Therefore, they can detect stopped vehicles and provide measurements of lane occupancy, vehicle count, speed, and vehicle length grouped into several length bins.
15.2.6.4 Video Image Processing
Video cameras were originally introduced to traffic management for roadway surveillance based on their ability to transmit closed-circuit television imagery to a human operator for interpretation. Present-day traffic managers utilize video image processing to automatically analyze the scene of interest and extract information for traffic surveillance and management. A video image processor (VIP) system typically consists of one or more cameras, a microprocessor-based computer for digitizing and analyzing the imagery, and software for interpreting the images and converting them into traffic flow data. A VIP can replace several in-ground inductive loops, provide detection of vehicles across several lanes, and perhaps lower maintenance costs. Some VIP systems process data from more than one camera and further expand the area over which data are collected.
Video image processors can classify vehicles by their length (usually three length classification ranges are available) and report vehicle presence, volume, lane occupancy, and speed for each class and lane. VIPs that track vehicles may also have the capability to register turning movements and lane changes. Vehicle density, link travel time, and origin-destination pairs are potential traffic parameters that can be obtained by analyzing data from a series of image processors installed along a section of roadway.
15.2.6.5 Passive Infrared Sensors
Active and passive infrared sensors are manufactured for traffic flow monitoring applications. Passive infrared sensors transmit no energy of their own. Rather they detect energy from two sources:
- Energy emitted from vehicles, road surfaces, and other objects in their field-of-view, and
- Energy emitted by the atmosphere and reflected by vehicles, road surfaces, or other objects into the sensor aperture.
Passive infrared sensors are mounted overhead to view approaching or departing traffic. They can also be mounted in a side-looking configuration. Infrared sensors are utilized for volume, speed, and class measurement; and for detection of pedestrians in crosswalks. Figure 15-4 illustrates the passive infrared sensor mounted for multiple detection zones.
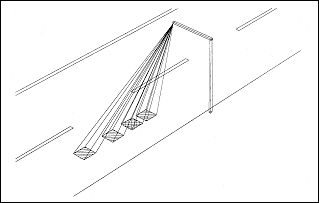
Figure 15-4: Multiple Detection Zone Configuration in a Passive Infrared Sensor (1)
15.2.6.6 Laser Radar Sensors
Laser radar sensors are active devices that transmit and receive infrared energy. They illuminate detection zones with low power energy transmitted by laser diodes operating in the near infrared region of the electromagnetic spectrum at 0.85 µm. A portion of the transmitted energy is reflected or scattered by vehicles back towards the sensor. Models are available that scan infrared beams over 1 or 2 lanes or use multiple laser diode sources to emit a number of fixed beams that cover the desired lane width. An example of a laser radar beam-scanning configuration is shown in Figure 15-5. Laser radars provide vehicle presence, volume, speed, length assessment, queue measurement, and classification. Multiple units can be installed at the same intersection without interference from transmitted or received signals. Modern laser sensors produce two- and three-dimensional imagery of vehicles suitable for vehicle classification. Their ability to classify 11 types of vehicles has found application on toll roads.
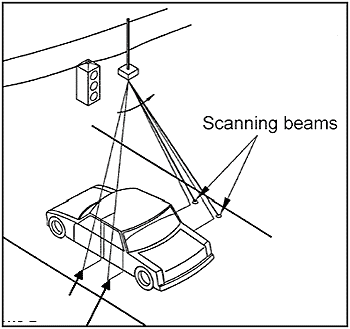
Figure 15-5: Scanning Infrared Laser Radar Two-Beam
Pattern Across a Traffic Lane
(Drawing courtesy of Schwartz Electro-Optics,
Orlando, FL)
15.2.6.7 Ultrasonic Sensors
Ultrasonic sensors transmit pressure waves of sound energy at a frequency between 25 and 50 kHz, which are above the human audible range. Most ultrasonic sensors operate with pulse waveforms and provide vehicle count, presence, and occupancy information. Pulse-shape waveforms measure distances to the road surface and vehicle surface by detecting the portion of the transmitted energy that is reflected towards the sensor from an area defined by the transmitter's beamwidth. When a distance other than that to the background road surface is measured, the sensor interprets that measurement as the presence of a vehicle.
Pulsed energy transmitted at two known and closely spaced incident angles allows vehicular speed to be calculated by recording the time at which the vehicle crosses each beam. Since the beams are a known distance apart, the speed can be calculated as beam separation distance divided by the time to traverse the beams. The preferred mounting configurations for range-measuring, pulsed ultrasonic sensors are looking from an overhead position and side viewing as shown in Figure 15-6. Constant frequency ultrasonic sensors that measure speed using the Doppler principle are also manufactured. However, these are more expensive than pulsed models. The speed-measuring Doppler ultrasonic sensor is designed to interface with the highway infrastructure in Japan.
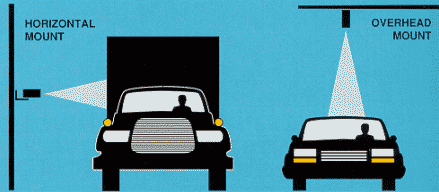
Figure 15-6: Mounting of Ultrasonic Range-Measuring
Sensors (1)
(Courtesy of Microwave Sensors, Ann Arbor, MI)
15.2.6.8 Passive Acoustic Array Sensors
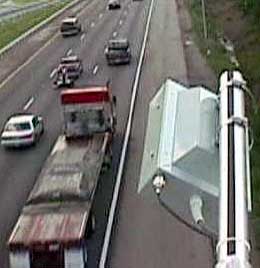
Figure 15-7: Acoustic Array Sensor Mounted Along Roadway (Courtesy of SmarTek Systems, Woodbridge, VA)
Acoustic sensors measure vehicle passage, presence, and speed by detecting acoustic energy or audible sounds produced by vehicular traffic from a variety of sources within each vehicle and from the interaction of a vehicle's tires with the road. When a vehicle passes through the detection zone, an increase in sound energy is recognized by the signal processing algorithm and a vehicle presence signal is generated. When the vehicle leaves the detection zone, the sound energy level drops below the detection threshold and the vehicle presence signal is terminated. Sounds from locations outside the detection zone are attenuated. Single lane and multiple lane models of acoustic sensors are marketed. Both detect the sounds produced by approaching vehicles with a two-dimensional array of microphones. (Figure 15-7)
15.2.6.9 Sensor Combinations
Figure 15-8 illustrates sensors that combine passive infrared presence detection with ultrasound or CW Doppler microwave radar. The passive infrared-ultrasonic combination, shown in the left portion of the figure, provides enhanced accuracy for presence and queue detection, vehicle counting, and height and distance discrimination.
The passive infrared-CW Doppler radar sensor, in the right portion of the figure, is designed for presence and queue detection, vehicle counting, speed measurement, and length classification. It relies on the radar to measure high to medium vehicle speeds and the passive infrared to measure vehicle count and presence. At medium speeds, the multiple detection zone passive infrared automatically calibrates its speed measurements against the radar's. This calibration permits the infrared to measure slow vehicle speeds and detect stopped vehicles.
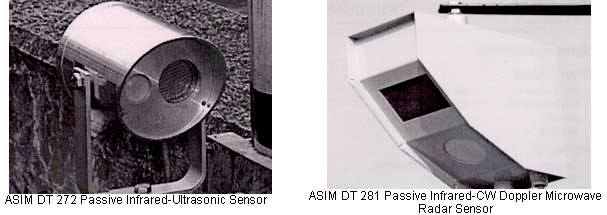
Figure 15-8: Passive Infrared Combination Sensors (1)
(Photographs courtesy of ASIM Technologies, Uznach, Switzerland)
| Technology | Strengths | Weaknesses |
|---|---|---|
| Inductive Loop |
|
|
| Magnetometer (Two-axis fluxgate magnetometer) |
|
|
| Magnetic (Induction or search coil magnetometer) |
|
|
| Microwave Radar |
|
|
| Active Infrared (Laser radar) |
|
|
| Passive Infrared |
|
|
| Ultrasonic |
|
|
| Acoustic |
|
|
| Video Image Processor |
|
|
| Sensor Technology | Count | Presence | Speed | Output Data Occupancy | Classification | Multiple Lane, Multiple Detection Zone Data | Communication Bandwidth | Sensor Purchase Costa (each in 1999 US$) |
|---|---|---|---|---|---|---|---|---|
| Inductive Loop | Low to Moderate | Lowi ($500 – $800) |
||||||
| Magnetometer (two axis fluxgate) |
Low | Moderatei ($900 – $6,300) |
||||||
| Magnetic Induction Coil | Low | Low to Moderatei ($385 – $2,000) |
||||||
| Microwave Radar | Moderate | Low to Moderate ($700 – $2,000) |
||||||
| Active Infrared | Low to Moderate | Moderate to High ($6,500 – $3,300) |
||||||
| Passive Infrared | Low to Moderate | Low to Moderate ($700 – $1,200) |
||||||
| Ultrasonic | Low | Low to Moderate (Pulse model: $600–) |
||||||
| Acoustic Array | Low to Moderate | Moderate ($3,100 – $8,100) |
||||||
| Video Image Processor | Low to Highh | Moderate to High ($5,000 – $26,000) |
b. Speed can be measured by using two sensors a known distance apart or estimated from one sensor, the effective detection zone and vehicle lengths.
c. With specialized electronics unit containing embedded firmware that classifies vehicles.
d. With special sensor layouts and signal processing software.
e. With microwave radar sensors that transmit the proper waveform and have appropriate signal processing.
f. With multi-detection zone passive or active mode infrared sensors.
g. With models that contain appropriate beamforming and signal processing.
h. Depends on whether higher-bandwidth raw data, lower-bandwidth processed data, or video imagery is transmitted to the TMC.
i. Includes underground sensor and local detector or receiver electronics. Electronic options are available to receive multiple sensor, multiple lane data.
15.2.6.10 Sensor Subsystem Architecture
Many systems utilize a field processor (e.g., 2070 controller) for collecting and processing raw data (including error checking) from multiple sensors comprising a detector station, prior to transmission of the information to the Traffic Management Center (TMC). Information transmission may be on a periodic basis (e.g., once every 20 seconds to a minute), or on an exception basis (e.g., information is transmitted only when a significant change occurs in the traffic flow, such as a major change in average speeds). Additional information on 2070 controllers can be found in the Traffic Detector Handbook and in the Traffic Control Systems Handbook.