1.0 INTRODUCTIONThe U.S. Department of Transportation (U.S. DOT) awarded grants in 2007 and 2008 to six metropolitan areas for implementation of congestion reduction strategies under the Urban Partnership Agreement (UPA) and Congestion Reduction Demonstration (CRD) programs. The San Francisco UPA was one of the selected sites. Based on a competitive procurement process, the U.S. DOT also selected the Battelle team to conduct the national evaluations of the UPA projects. This document presents the San Francisco UPA National Evaluation Plan developed by the Battelle team, in cooperation with the San Francisco UPA partners and the U.S. DOT. This introduction section describes U.S. DOT's congestion reduction programs and the strategies being implemented at the various sites. The organization of this report is also presented. 1.1 U.S. DOT Program to Reduce CongestionTransportation system congestion is a significant threat to the economic prosperity and quality of life in the U.S. Whether it takes the form of trucks stalled in traffic, cargo stuck at overwhelmed seaports, or airplanes stuck on the tarmac, congestion costs the nation an estimated $200 billion a year. Traffic congestion in major metropolitan areas is a key part of this problem. In 2007, congestion caused urban Americans to travel 4.2 billion hours more and to purchase an extra 2.8 billion gallons of fuel. The value of time spent and out of pocket fuel costs represented a total congestion cost of $87.2 billion—an increase of more than 50 percent from a decade ago.2 Congestion affects the quality of life in America by robbing time that could be spent socializing with families and friends, participating in civic life, and pursuing recreational activities. As indicated in Figure 1-1, which reflects conditions in 14 of the nation's largest urban areas representing 54 percent of the population, the total hours of traffic delay grew approximately 340 percent from 1982 to 2007 and the miles traveled under extreme congestion more than tripled, from 8 percent to 28 percent. 1.1.1 Urban Partnership Agreement/Congestion Reduction Demonstration Program OverviewU.S. DOT entered into UPAs with cities, pursuant to their commitment to implement “broad congestion pricing.” In December 2006, the U.S. DOT issued a Federal Register Notice soliciting cities to apply for Urban Partnership status by April 30, 2007. For the cities that were selected, this Urban Partnership status would confer priority for available federal discretionary funds of approximately $1 billion across about a dozen programs. The applicants' proposals for congestion reduction were to be based on four complementary strategies known as the 4Ts: Tolling, Transit, Telecommuting, which includes additional travel demand management (TDM) strategies, and Technology. 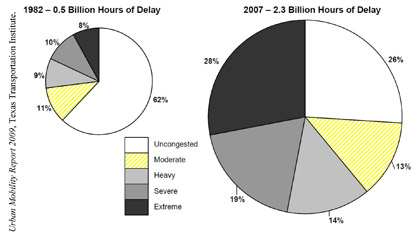
Figure 1-1. Percentage of Vehicle Miles Traveled by Congestion Level in Very Large Urban Areas, 1982 versus 2007 In August 2007, the selection of five urban partners was announced—Miami, Minnesota, New York City, San Francisco, and Seattle—along with a total of $853 million in federal discretionary grants for these partners. On April 7, 2008, the New York State Assembly declined to take a formal vote to provide needed legislative authority to implement the proposed New York City congestion-pricing project. The U.S. DOT announced that the UPA funds previously targeted for New York would be made available to other areas for implementing congestion pricing and supporting strategies. In 2007, the U.S. DOT announced a follow-up to the UPA Program, called the Congestion Reduction Demonstration Initiative. The November 13, 2007, Federal Register notice set a December 31, 2007, deadline for applications. Subsequently, the U.S. DOT announced a $210.6 million CRD award to the City of Los Angeles and a $153 million award to the City of Chicago. Chicago was subsequently removed from the program when deadlines for pricing legislation were not met. Atlanta was selected for a CRD grant in November 2008 and will become part of the national evaluation. A wide range of strategies and projects are being implemented at the UPA/CRD sites using the 4Ts. Table 1-1 highlights the strategies being deployed at the various UPA/CRD sites. Many of the San Francisco UPA projects focus on pricing of parking as a strategy for managing congestion in the city of San Francisco, and these will be the subject of the national evaluation. Parking-related projects include variable pricing of on-street parking and city-owned garages, real-time parking information disseminated by phone, websites, and dynamic message signs, an integrated payment system for parking and transit, and use of outreach for telecommuting and alternate commute programs to support the parking pricing program. Other UPA-funded projects in San Francisco not being evaluated include a multimodal trip planner, real-time transit information, a demonstration of vehicle-infrastructure integration, a road re-construction project, ferry improvements, travel forecasting, and development of information for HOV to HOT conversion in the region.
1.2 Organization of this ReportThe remainder of this report is divided into four sections. Chapter 2.0 discusses the San Francisco UPA. An overview of the transportation system in the San Francisco metropolitan area is presented first, followed by a description of the San Francisco UPA partners and the UPA projects, funding, and deployment schedule. Chapter 3.0 provides an overview of the national evaluation organizational structure, the national evaluation process and framework, the U.S. DOT guiding questions and evaluation analyses, and the San Francisco UPA evaluation process. Chapter 4.0 presents the San Francisco UPA evaluation plan. The chapter discusses 10 evaluation analyses and describes the preliminary evaluation test plans. The report concludes with a discussion of the next steps in the San Francisco UPA national evaluation process. 1 David Schrank and Tim Lomax, "Urban Mobility Report 2009." Texas Transportation Institute, The Texas A&M University System, July 2009. | |||||||||||||||||||||||||||||||||||||||||||||||||||||||||||||||||||||||||||||||||||||||||||||||||||||||||||||||||||||||||||||||||||||||||||||||||||||||||||||||||||||||||
| US DOT Home | FHWA Home | Operations Home | Privacy Policy | ||