Next Generation Traveler Information System: A Five Year Outlook
CHAPTER 2. TRAVELER NEEDS ROADMAP (2014-2020)
This roadmap chapter considers today's traveler needs and projects upcoming requirements as reflected in consumer research. It focuses on the questions:
- What are the future trends of the traveler information needs, e.g., types of information, coverage, timeliness, accuracy?
- What are the trends and needs of urban versus rural areas?
2.1 WHO IS THE TRAVELER?
For agencies that choose to offer traveler-facing solutions, design starts with the end user. Who is the traveler and what functionality will they actually use? For those focused primarily on transportation network management, the same questions are important to understanding how to influence travelers to act in the way which best optimizes network efficiency.
In both cases, it is important to characterize the traveler and their context. This chapter outlines a segment analysis approach with an example set of traveler characterization factors, which can be used when considering a specific state or region, and a sample description of key high-level traveler segments.
Travelers can be characterized in a variety of different ways. This characterization, also described as 'segment analysis', is a useful tool in assessing overall user communities to determine appropriate NGTIS solutions. For example, a population which is largely rural and older may take much longer to accept new solutions than a younger urban group.
Once traveler segments are well-understood, this information can be used in considering both the required functionality of offerings and their deployment timing. Solutions for a rural community must be tailored to address the needs of longer distance travelers with fewer route and mode choices than those for a more urban group. Similarly, a community full of early adopters will quickly benefit from information delivery on the latest handheld platforms, while a more conservative community will not. At the same time, the early adopter community is quicker to move away from existing solutions in favor of the next hot option, demanding more aggressive technology deployment timelines.
These segments may also be used to test and monitor user response to NGTIS. Are specific segments adopting and responding to new NGTIS offerings as expected? Is their new behavior having the expected / desired impact on the overall transportation network? Is a new offering generating positive customer satisfaction ratings among this group?
2.1.1 Traveler Characterization Factors
In this analysis, it is helpful to review both travel factors and technology adoption factors for a target community. Travel factors provide insight into how and why people move from point to point, helping to clarify what those consumers' needs are as they do so. Technology adoption factors help shed light upon the tools people are most likely to use and benefit from as part of this process. A sample set of segment analysis factors is included in Table 1 below.
Table 1. Sample Segment Analysis Factors (SCG)
| Demographics |
Travel Reasons |
Travel Environment |
Offering Priorities |
|
Age |
Commute |
Modal options |
Functionality |
|
Socioeconomic group |
Social |
Trip location |
Effectiveness |

|
Errand |
Average trip distance |
Stability |
|
|
Repeat/one-off |
Average trip length |
Reputation |
|
|
Freight Delivery |
|
Adoption behavior |
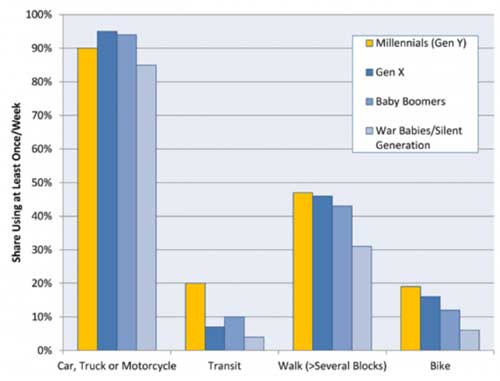
It is important to note that segment analysis is not a one-time exercise. For example, as new generations emerge, and older ones mature, behavior patterns may well change within a given age group. As shown in Figure 4, today's Millennials (i.e., Gen Y with birthdates from about 1980-2000) are an excellent example of this, as they are currently trending much lower than their predecessors on car ownership (Gen X (∼1960-1980), Baby Boomers (1946-1964), War Babies (∼1930-1946)). As they proceed through each life stage, they may continue to diverge from prior generations or they may revert to more traditional patterns. Ongoing segment analysis is a helpful framework for taking a structured look at state and local communities to understand their needs over time.
Figure 4. Graph. Snapshot of transportation mode usage by generation
(U.S. PIRG Education Fund, 2014)
2.1.2 Sample Segments
It is not possible to consider every permutation of possible factors which make up a potential customer segment in this report. Instead, we have partially characterized a few high-level segments below on a national basis as a sample. Although there are many possible segments which might need to be considered by an agency, we have characterized a few high-level segments below:
- Urban commuters.
- Rural drivers.
- Truck drivers.
2.1.2.1 Urban Commuters
- Travel Reasons: This group predominantly performs local trips to and from work, which represent approximately 28 percent of all daily trips on U.S. roadways and transit systems (Dorsey, 2015).
- Trip Length: Average national trip length trends were 25.5 minutes in 2011, which did not change from average length in 2000 (Polzin, 2013).
- Modal Options: They have the largest set of modal options, with 69 percent of urban households having access to transit (as opposed to 14 percent of rural households (ASCE, 2013).
2.1.2.2 Rural Drivers
- Travel Reasons: This group largely travels in rural areas, for either business or recreational purposes.
- Trip Length: Rural trips may be long duration, i.e., approximately 50-100 miles, with the possibility of changing conditions over the course of the travel.
- Modal options: This group may have reduced options and mobility in the event of situations that impact their trip, such as closures, incidents or adverse weather (Deeter, 2009).
2.1.2.3 Truck Drivers
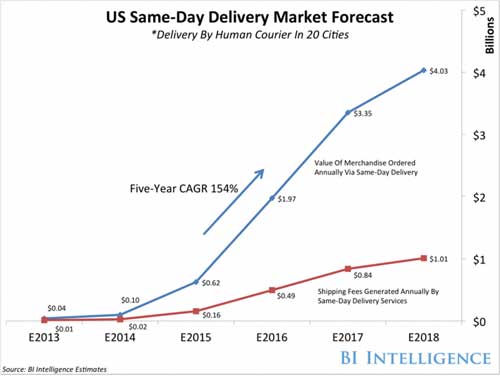
- Trip Distance: Truck drivers comprise 10 percent of vehicle miles traveled (VMT) in the US (US DOT, 2013). This number is increasing as e-commerce continues to grow, as shown in Figure 5 below (Smith, 2014) with the compound annual growth rate (CAGR).
- Offering Priorities: This driving community is highly time-sensitive, facing direct financial consequences for delay. As a result, the larger carriers have historically been prompt adopters of technologies with clear return on investment, although solutions must be hardened to meet the needs of both the truck driver demographic and the freight business.
- Trip Location: Truck drivers handle the bulk of interregional miles as well as an increasing percentage of urban travel.
Copyrighted 2015. Business Insider, Inc. 119663:0915DS
Figure 5. Graph. US Same-Day Delivery Market Forecast (Smith, 2014)
2.1.3 Overall Travel Trends
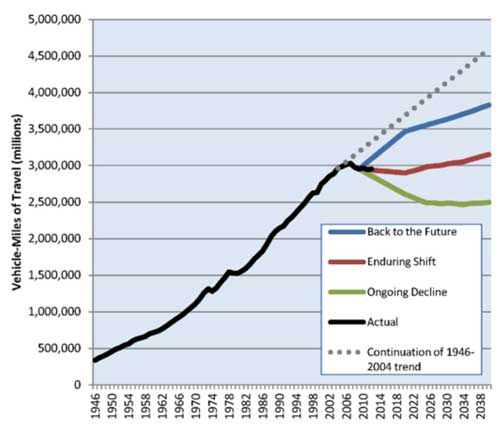
Overall VMT has decreased since about 2005. It should be noted that the timing for this shift varies regionally, and that projections of this trend to future years vary significantly. Some examples of future projections are shown in Figure 6. Researchers have posited a variety of factors driving the existing trend, but it remains to be seen which will prove to have the most impact. In the meantime, NGTIS planners and managers should monitor the situation in their area.
Figure 6. Graph. VMT Projections under Three Scenarios of Future Growth
(U.S. PIRG Education Fund, 2014)
2.2 WHAT ARE THEIR NEEDS/GOALS?
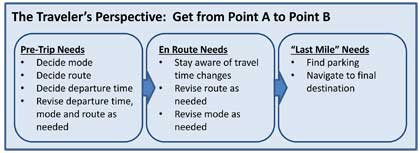
As shown in Figure 7 below, the traveler's primary focus is simply moving from one point to another. There are a variety of sub-needs associated with that goal, including information about decisions about mode, route and departure time.
Figure 7. Chart. Traveler Perspective (SCG)
At the next level of detail, specific information needs found in recent surveys (Brydia R. E., 2015) include:
- Expected delays between major points.
- Current travel times between major points.
- Current location and status of incidents.
- Locations and times for planned lane closures.
- Projected travel times between major points during their trip.
- Availability of information (routes/maps) for necessary detour.
- Current speeds between major points or smaller segments.
- Visual confirmation of conditions at selected points.
- Coverage across the entire trip, regardless of roadway choice or jurisdiction.
- Pre-trip access to traveler information for planning (days or hours in advance).
- En route access to traveler information.
- Information of interest along route, including tolls, roadway restrictions, weather events, rest stops, food, gas, lodging, and information related to tourism.
On the transit side, needs include (Brydia R. E., 2015):
- Real-Time:
- Transit departure/arrival time.
- Service changes.
- Outages.
- Parking availability and fees.
- Current system delays.
- Current information on alternate modes.
- Static:
- Schedule, fare, security, and accessibility information.
- Transfer information.
- Directions to/from transit locations.
2.2.1 Information Need Trends
While traveler needs as shown in Figure 7 are not changing, expectations for meeting these needs are growing rapidly, as connected consumers become used to instant access to information and services.
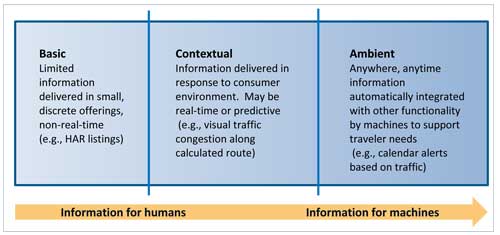
Figure 8 provides a high level view of the evolution in information need trends, from a focus on basic information used by humans to make travel decisions to the availability of more sophisticated collections of information which can be used by computers to automate support for traveler needs. These and other information attributes and types of information are described in more detail in the subsections below.
Figure 8. Chart. Traveler Information Roadmap (SCG)
2.2.1.1 Information Attributes
The core attributes, such as quality, availability, timeliness, functionality and reliability of data continue to be a focus for all providers. Key trends in this area include:
- Anytime/anywhere availability. Connected consumers expect to be able to access information wherever they are, on whatever device they happen to be using.
- Contextual filtering. Simple availability, however, does not go quite far enough. There is so much data available at this point that consumers are now asking for data and service providers to deliver only "exactly what, when, and where needed." Consumers want their data filtered for local and individual relevance and provided in their preferred format. One example of this is the interest in multi-lingual data. (Deeter, 2009) Another is the concept of safety-oriented traveler information such as real-time warnings of upcoming traffic jams to help avoid rear-end collisions with stationary queues. (TomTom, 2013)
- Ambient data use. (Daecher & Galizia, 2015) As the Internet of Things evolves, certain types of data become more useful when employed by machines than by humans. Current examples include map data, which is increasingly used by machines to provide directions, rather than by humans directly; and time data, which is a fundamental part of practically all automated activities. Traffic data appears to be headed in the same direction, as consumers are being offered functionality which takes the state of the transportation network into account, rather than consuming traffic incident information directly. One example would be applications which provide calendar alerts based on current or projected travel times. Another example is real estate applications which rate location suitability based on average commute times.
- Ability to Integrate. Fundamental to all of the previous points is the concept that traveler information is one of many types of data being processed in new ways and new combinations. It must be capable of being attached to locations, processed by calendars, and fused with multiple other data types to produce new functionality. One classic example is multimodal data – consumers increasingly expect to get information about every available mode, from bikeshare to carshare to transit, as well as related parking and traffic data, in one application.
2.2.1.2 Types of Information
The general trend for information types is simply "more", as service providers seek to deliver ever-improving functionality to their consumers. Specific data types that are receiving attention include:
- Arterial travel times. This information is required to deliver high-quality route choice functionality. Travelers want to know not only where problems are occurring, but the best ways around them. This is most practical in in areas with strong arterial alternatives to freeway travel.
- Parking. Parking data has been available for some time, but has found its way into the spotlight over the last two years or so, with a number of new smartphone apps and their inclusion by OEMs in in-vehicle infotainment solutions. Parking data claims a variety of strong benefits in addition to consumer convenience, including reduced congestion in central business districts.
- Predictive. True, real-time, predictive data has been a holy grail for traffic providers for decades. Recent advances in data availability and integration have moved the needle forward in this area, as providers seek to deliver quality estimated times of arrival for consumer use. For further discussion on predictive data, see the section titled "Aggregation and Analysis Technologies" in the next chapter.
- Environmental. A recent symposium on probe data showed increased private sector interest in providing environmental data such as emissions and fuel costs (Hamedi, 2015). These data may be of use both to planners and to system managers who provide it back to travelers in situations such as Ozone Action Days. Data to support electric vehicles was also discussed.
Rural vs. Urban
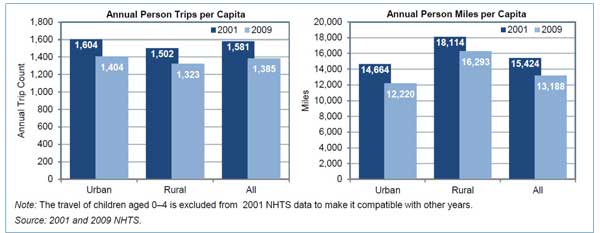
Rural travelers need information that caters to their travel patterns. Longer trips require more en route data to keep the traveler abreast of changes during the trip. As noted previously, rural drivers may also have reduced options and mobility in the event of situations that impact their trip, such as closures, incidents, or adverse weather. Figure 9 shows the contrast between rural and urban person trips and miles per capita. Per the NHTS, person trips may include any mode of travel, but rural travel is predominantly automobile travel.
Figure 9. Graph. Annual Person Trips and Person Miles per Capita by Urban/Rural
(US DOT, 2013)
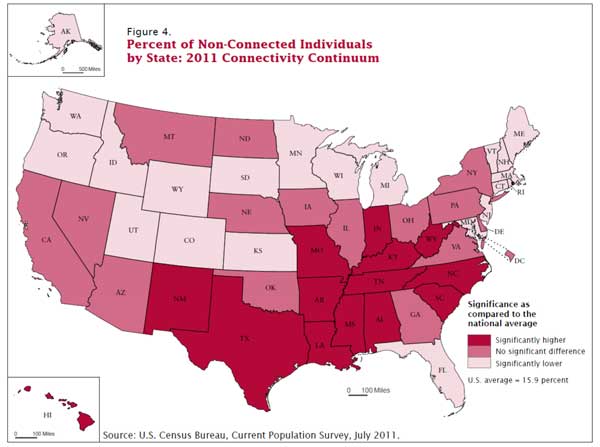
One key item to consider is that the rural availability and adoption of some technologies has historically been slower than urban. In some areas, for example, cellular coverage is still unreliable or non-existent. Figure 10 shows the state-level estimates of no connectivity, or individuals who did not connect to the Internet and lived in a home without a computer. This means that both information and delivery solutions must be appropriate to the environment and the demographic.
Figure 10. Map. State-level Connectivity Continuum (File, 2013)
2.3 WHAT IS THEIR DAILY CONTEXT?
It is important to consider NGTIS in the traveler lifestyle contexts in which they are used. Key trends in this area include:
- Rapid mobile device adoption. At this point, the majority of American adults have smartphones, and adoption rates continue to grow. A broad array of other mobile devices are also quickly becoming fixtures in consumer households, fueling the expectation that at any given moment, a screen providing information access will be ready-to-hand. From a public sector perspective, it is important to serve both the mobile device-enabled community and those who have not yet moved to this technology. At the same time, the extremely high usage levels of these new platforms among those who do have them makes it equally important to carefully consider the new platforms as they emerge. As of January 2014:
- 90 percent of American adults have a cell phone.
- 58 percent of American adults have a smartphone.
- 42 percent of American adults own a tablet computer (Pew Internet Project, n.d.).
- Traveler Information access via smartphone. There are relatively few studies on this topic, but it is clear that travelers are using their smartphones as a routine source of travel information, with most reporting use of directions/navigation, and somewhat fewer mentioning traffic and transit information. We have not found any studies which show a direct correlation between smartphone device ownership and use of smartphones for traveler information – the studies simply note that certain percentages of smartphone owners do use their phones in this way. It is reasonable to project that in the years since these studies were done, this trend has continued upwards.
It is important to note that many of those getting directions may also be receiving traffic data along their routes without having to ask for it separately (e.g., via Google Maps). Another item to consider is the variation in this usage among user segments, which may help an agency understand how best to serve certain communities. For example, one study shows African-Americans using their cellphones 31 percent of the time in the past month to get up-to-the-minute traffic or public transit information while whites in the same study reported using their phones in this way 16 percent of the time. (Rainie & Fox, 2012)
- 74 percent of adult smartphone owners ages 18 and older say they use their phone to get directions or other information based on their current location.
- In an April 2012 survey, 20 percent of users surveyed have used their phone to get up-to-the-minute traffic or public transit information to find the fastest way to get somewhere in the past 30 days (US DOT, 2015).
- Some 65 percent of smartphone owners say they have gotten turn-by-turn navigation or directions while driving, with 15 percent doing so on a typical day. (Rainie & Fox, 2012)
- A 2012 survey of 752 drivers along I-35 in Texas showed that 60% used traffic- or travel-related applications on their cell phone or device. (Brydia R. E., 2012).
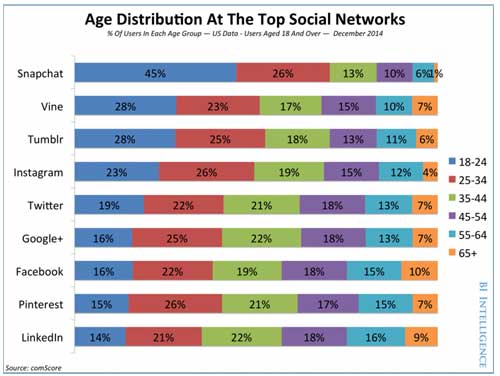
- Social media evolution by age group. Social media is the focus of a great deal of attention, and continues to grow rapidly. However, it is important to note variations by user segment in this area as well, particularly age-related ones. For example, millennials are very heavy Facebook users (over 90 percent), while fewer than 40 percent use Twitter. (MarketingCharts, 2015). An alternative analysis of social media demographics is shown below in Figure 11.
Copyrighted 2015. Business Insider, Inc. 119663:0915DS
Figure 11. Graph. Demographic Composition of Social Networks (Hoelzel, 2015)