Freight Facts and Figures 2013
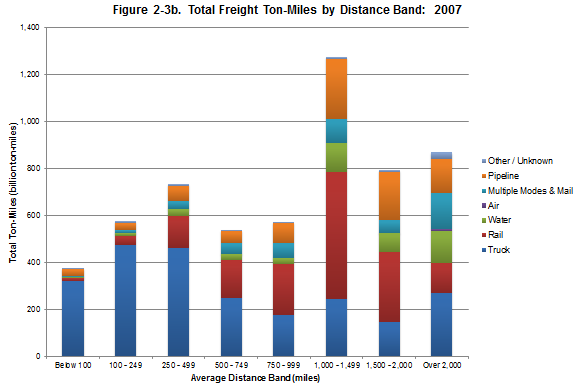
Figure 2-3b. Total Freight Ton-Miles by Distance Band: 2007
Nearly one-fourth of all ton-miles occur at distances between 1,000-1,499 miles. FAF estimated the freight industry moved goods over 5.7 trillion ton-miles in 2007.
Figure 2-3b
[PDF 62KB]
Data represented in the figure.
Millions of tons
| Mileage range | Truck | Rail | Water | Air | Multiple Modes and Mail | Pipeline | Other/Unknown | Total |
|---|---|---|---|---|---|---|---|---|
| Below 100 | 321 | 12 | 7 | 0 | 4 | 27 | 8 | 378 |
| 100-249 | 476 | 36 | 15 | 0 | 11 | 32 | 9 | 578 |
| 250-499 | 460 | 138 | 30 | 0 | 33 | 62 | 10 | 734 |
| 500-749 | 248 | 161 | 29 | 0 | 44 | 52 | 6 | 539 |
| 750-999 | 178 | 215 | 28 | 0 | 63 | 82 | 7 | 573 |
| 1,000-1,499 | 247 | 540 | 120 | 1 | 102 | 255 | 10 | 1,274 |
| 1,500-2,000 | 148 | 297 | 81 | 1 | 57 | 203 | 6 | 791 |
| Over 2,000 | 272 | 124 | 139 | 7 | 156 | 143 | 31 | 871 |
| Total | 2,349 | 1,522 | 450 | 9 | 469 | 855 | 86 | 5,739 |
Source:
U.S. Department of Transportation, Federal Highway Administration, Office of Freight Management and Operations, Freight Analysis Framework, version 3.4, 2012.
You may need the Microsoft Excel Viewer to view Excel files on this page.
You may need the Adobe® Reader® to view the PDFs on this page.